Summary Table (Download Table)
| Co-regulatory TF | Tissue | -log(P) |
  | | |
| MEF-2 | muscle | 11.5827 |
| COUP-TF/HNF-4 | liver | 11.1634 |
| HNF-1 | peripheral_nervous_system | 10.2346 |
| ELK-1 | small_intestine | 8.849 |
| OCT-1 | muscle | 8.67902 |
| TAX/CREB | larynx | 8.64387 |
| TAL-1BETA/ITF-2 | muscle | 8.28106 |
| HNF-1 | colon | 7.97382 |
| TATA | muscle | 7.70407 |
| AP-1 | heart | 7.54639 |
| ATF | tongue | 7.1983 |
| NR2E3 | kidney | 7.19781 |
| NRF-1 | larynx | 7.04432 |
| GATA-X | heart | 6.91521 |
| PPARG | larynx | 6.81861 |
| OCT-1 | heart | 6.53189 |
| MEF-2 | larynx | 6.42869 |
| POU1F1 | peripheral_nervous_system | 6.38773 |
| SREBP-1 | larynx | 6.28353 |
| E2F | small_intestine | 6.22389 |
| BACH1 | heart | 6.20711 |
| POU3F2 | eye | 6.19999 |
| ELK-1 | bone_marrow | 6.19404 |
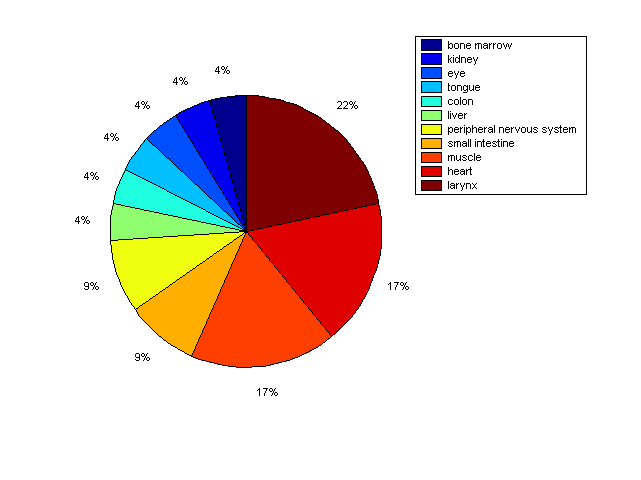
Distribution of Co-regulatory TFs
|
|
|
Description: this pie chart displays the distribution of co-regulatory transcription factors (TFs) in different tissues. Color schema: the tissue with the largest percentage of co-regulatory TFs is colored dark red whereas the tissue with the smallest percentage of co-regulatory TFs is colored dark blue. Tissues with intermediate percentages of co-regulatory TFs are colored from light red to yellow and cyan and then to light blue. |