Summary Table (Download Table)
| Co-regulatory TF | Tissue | -log(P) |
  | | |
| FOXJ2 | brain | 9.81389 |
| STAT5A | brain | 9.51118 |
| HNF-1 | liver | 8.1863 |
| ELK-1 | bone_marrow | 8.104 |
| C/EBP | muscle | 8.05676 |
| WHN | small_intestine | 7.60093 |
| HNF-1 | kidney | 7.59978 |
| TEF-1 | larynx | 7.56435 |
| EF-C | brain | 7.19997 |
| NRL | larynx | 7.13736 |
| BACH1 | eye | 7.11534 |
| ELK-1 | blood | 7.00212 |
| CRX | eye | 6.70131 |
| C/EBP | brain | 6.64643 |
| CDC5 | brain | 6.60198 |
| FOXO1 | spleen | 6.52921 |
| TATA | muscle | 6.45333 |
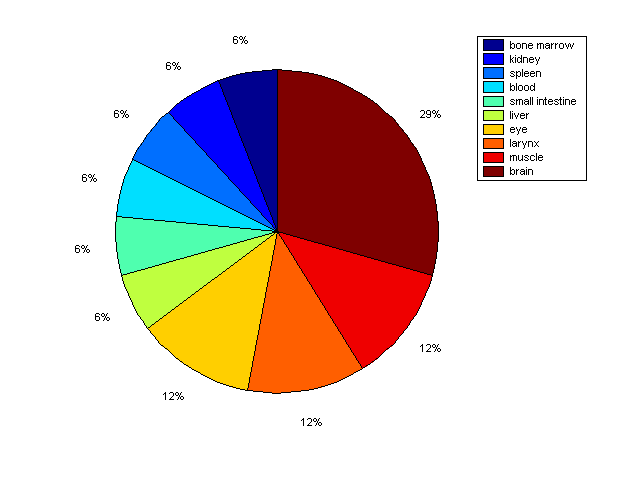
Distribution of Co-regulatory TFs
|
|
|
Description: this pie chart displays the distribution of co-regulatory transcription factors (TFs) in different tissues. Color schema: the tissue with the largest percentage of co-regulatory TFs is colored dark red whereas the tissue with the smallest percentage of co-regulatory TFs is colored dark blue. Tissues with intermediate percentages of co-regulatory TFs are colored from light red to yellow and cyan and then to light blue. |