Summary Table (Download Table)
| Co-regulatory TF | Tissue | -log(P) |
  | | |
| MEF-2 | muscle | 20.5043 |
| NKX6-2 | small_intestine | 16.7463 |
| FOXJ2 | eye | 14.9791 |
| SREBP-1 | bladder | 14.5935 |
| LHX3 | small_intestine | 13.1414 |
| MEF-2 | heart | 13.0923 |
| FOXD3 | small_intestine | 12.6603 |
| FREAC-3 | small_intestine | 12.5975 |
| RSRFC4 | muscle | 10.6864 |
| MEF-2 | eye | 10.6795 |
| E12 | tongue | 10.0178 |
| OCT-1 | brain | 9.89764 |
| USF | bladder | 9.51969 |
| TEF | eye | 9.43066 |
| MAX | bladder | 9.41265 |
| TCF-4 | small_intestine | 9.15733 |
| AHR/ARNT | mammary_gland | 8.94551 |
| USF | muscle | 8.87297 |
| HNF-1 | kidney | 8.5119 |
| FOXJ2 | small_intestine | 8.48735 |
| E2F | tongue | 8.41089 |
| USF2 | bladder | 8.1376 |
| SMAD-3 | thymus | 8.04391 |
| HNF-1 | colon | 8.03489 |
| GATA-6 | heart | 7.81442 |
| IRF1 | small_intestine | 7.62101 |
| CDP | placenta | 7.58097 |
| FOXJ2 | bone | 7.56541 |
| IPF1 | small_intestine | 7.5252 |
| TGIF | muscle | 7.39432 |
| NF-Y | tongue | 7.37447 |
| SP3 | tongue | 7.31877 |
| SREBP-1 | muscle | 7.23739 |
| ALPHA-CP1 | larynx | 7.22505 |
| COUP-TF/HNF-4 | small_intestine | 7.21714 |
| OCT-1 | bone | 7.15848 |
| ALPHA-CP1 | tongue | 7.12055 |
| RFX1 | muscle | 7.11026 |
| STAT5A | eye | 7.03321 |
| OCT-1 | small_intestine | 7.01432 |
| C-MYC/MAX | bladder | 6.93753 |
| CRX | liver | 6.92513 |
| RREB-1 | muscle | 6.85145 |
| ELK-1 | tongue | 6.81045 |
| ATF-1 | pancreas | 6.79016 |
| ARNT | bladder | 6.77716 |
| MEF-2 | larynx | 6.73036 |
| FREAC-4 | small_intestine | 6.72356 |
| MEF-2 | small_intestine | 6.69197 |
| STAT5A | soft_tissue | 6.60696 |
| ATF | tongue | 6.59422 |
| GATA-1 | larynx | 6.58782 |
| GR | larynx | 6.56475 |
| LEF-1 | brain | 6.47855 |
| GATA-1 | tongue | 6.41551 |
| CART-1 | small_intestine | 6.34111 |
| TATA | small_intestine | 6.31879 |
| FAC1 | tongue | 6.31268 |
| LMO2_COMPLEX | heart | 6.30145 |
| MYOD | tongue | 6.28703 |
| ATF4 | larynx | 6.19433 |
| ALPHA-CP1 | eye | 6.16476 |
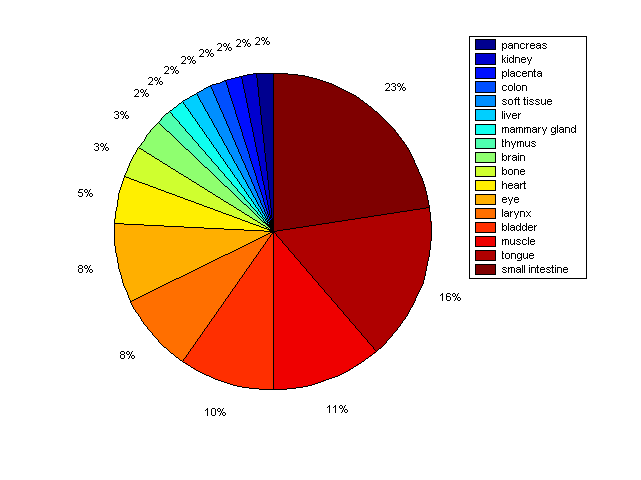
Distribution of Co-regulatory TFs
|
|
|
Description: this pie chart displays the distribution of co-regulatory transcription factors (TFs) in different tissues. Color schema: the tissue with the largest percentage of co-regulatory TFs is colored dark red whereas the tissue with the smallest percentage of co-regulatory TFs is colored dark blue. Tissues with intermediate percentages of co-regulatory TFs are colored from light red to yellow and cyan and then to light blue. |