Summary Table (Download Table)
| Co-regulatory TF | Tissue | -log(P) |
  | | |
| MYOD | peripheral_nervous_system | 15.2806 |
| HSF2 | eye | 11.7781 |
| ATF | eye | 11.453 |
| SREBP-1 | peripheral_nervous_system | 11.1746 |
| NRF-1 | pancreas | 9.77589 |
| CRX | eye | 9.43669 |
| HSF1 | eye | 9.27905 |
| NF-Y | peripheral_nervous_system | 8.94009 |
| MEF-2 | muscle | 8.92075 |
| HNF-1 | kidney | 8.91599 |
| ATF3 | peripheral_nervous_system | 8.67913 |
| E12 | peripheral_nervous_system | 8.66615 |
| PPAR | peripheral_nervous_system | 8.61771 |
| ATF-1 | pancreas | 8.5806 |
| AP-1 | muscle | 8.51149 |
| ATF6 | peripheral_nervous_system | 8.13144 |
| SOX-9 | brain | 7.98365 |
| AR | soft_tissue | 7.9706 |
| SMAD-3 | peripheral_nervous_system | 7.91138 |
| ATF | pancreas | 7.91056 |
| RSRFC4 | muscle | 7.8262 |
| P53 | stomach | 7.35467 |
| GATA-6 | eye | 7.31573 |
| CDP_CR1 | brain | 7.07262 |
| HEB | eye | 7.03163 |
| LMO2_COMPLEX | colon | 6.94289 |
| FREAC-4 | soft_tissue | 6.85375 |
| SF-1 | soft_tissue | 6.82265 |
| TATA | soft_tissue | 6.71411 |
| FOXO1 | soft_tissue | 6.66809 |
| GCNF | soft_tissue | 6.34374 |
| OCT-1 | colon | 6.34045 |
| IRF-7 | skin | 6.27134 |
| AREB6 | bone_marrow | 6.1786 |
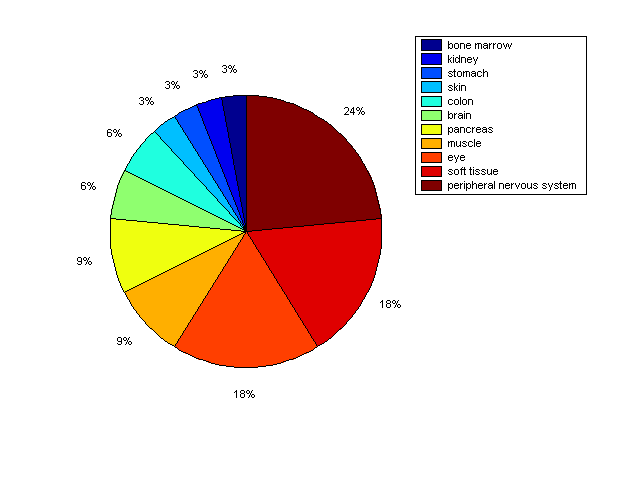
Distribution of Co-regulatory TFs
|
|
|
Description: this pie chart displays the distribution of co-regulatory transcription factors (TFs) in different tissues. Color schema: the tissue with the largest percentage of co-regulatory TFs is colored dark red whereas the tissue with the smallest percentage of co-regulatory TFs is colored dark blue. Tissues with intermediate percentages of co-regulatory TFs are colored from light red to yellow and cyan and then to light blue. |