Summary Table (Download Table)
| Co-regulatory TF | Tissue | -log(P) |
  | | |
| MIF-1 | bone | 123.602 |
| RFX1 | bone | 99.3461 |
| EF-C | bone | 43.8914 |
| GATA-3 | bone | 26.7049 |
| MAZ | bone | 24.0229 |
| LHX3 | small_intestine | 20.6976 |
| GATA-1 | bone | 17.9911 |
| SREBP-1 | bone | 16.6488 |
| GATA-2 | bone | 15.7809 |
| MAZR | bone | 15.2221 |
| LMO2_COMPLEX | bone | 13.0551 |
| RFX1 | brain | 12.4641 |
| PU.1 | bone | 11.7723 |
| FREAC-4 | bone | 11.5596 |
| NRF-1 | testis | 11.5563 |
| HNF-1 | small_intestine | 11.5283 |
| PBX-1 | small_intestine | 10.6341 |
| NKX6-2 | small_intestine | 10.398 |
| HNF-1 | kidney | 10.3405 |
| CACCC-BINDING_FACTOR | brain | 10.0704 |
| CART-1 | small_intestine | 10.0006 |
| USF | testis | 9.70174 |
| NRF-1 | larynx | 9.35217 |
| SREBP-1 | brain | 9.25555 |
| C-ETS-1 | bone | 8.96229 |
| TCF11/MAFG | eye | 8.80427 |
| TATA | muscle | 8.77324 |
| NF-E2 | eye | 8.69391 |
| OSF2 | bone | 8.48719 |
| CHX10 | brain | 8.4104 |
| BSAP | bone | 8.3552 |
| USF | bone | 8.34792 |
| HFH-3 | small_intestine | 8.31899 |
| NF-AT | small_intestine | 8.25973 |
| GR | bone | 8.23807 |
| CDP | small_intestine | 8.15907 |
| OCT-1 | bladder | 7.77568 |
| FOXD3 | small_intestine | 7.74777 |
| AML-1A | bone | 7.67362 |
| AML1 | bone | 7.67362 |
| MEIS1A/HOXA9 | brain | 7.66907 |
| RFX1 | pancreas | 7.33676 |
| SREBP-1 | testis | 7.29602 |
| MEIS1 | brain | 7.27526 |
| RORALPHA2 | brain | 7.19997 |
| HFH-4 | small_intestine | 7.17873 |
| CREB | brain | 7.11057 |
| HNF-1 | liver | 7.00281 |
| C/EBPDELTA | liver | 6.95342 |
| PAX-8 | brain | 6.77029 |
| ELF-1 | bone | 6.75079 |
| IPF1 | brain | 6.73849 |
| OCT-1 | uterus | 6.72202 |
| TEL-2 | bone | 6.70015 |
| NF-KAPPAB_(P50) | uterus | 6.66602 |
| PBX1B | brain | 6.61294 |
| LHX3 | brain | 6.61096 |
| TEF | uterus | 6.57133 |
| PAX-1 | brain | 6.4686 |
| PITX2 | brain | 6.46789 |
| NF-E2 | bone | 6.4601 |
| AP-1 | stomach | 6.30344 |
| LHX3 | lung | 6.29355 |
| AP-4 | brain | 6.24901 |
| AP-1 | bone | 6.21679 |
| TBP | brain | 6.21612 |
| NERF1A | bone | 6.21014 |
| TAL-1BETA/ITF-2 | brain | 6.20537 |
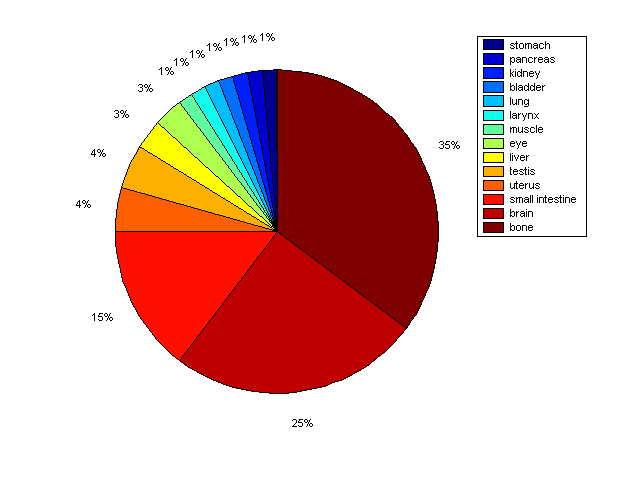
Distribution of Co-regulatory TFs
|
|
|
Description: this pie chart displays the distribution of co-regulatory transcription factors (TFs) in different tissues. Color schema: the tissue with the largest percentage of co-regulatory TFs is colored dark red whereas the tissue with the smallest percentage of co-regulatory TFs is colored dark blue. Tissues with intermediate percentages of co-regulatory TFs are colored from light red to yellow and cyan and then to light blue. |