Summary Table (Download Table)
| Co-regulatory TF | Tissue | -log(P) |
  | | |
| HNF-1 | kidney | 17.5519 |
| POU3F2 | heart | 11.2963 |
| OCT-1 | small_intestine | 10.89 |
| FOXJ2 | eye | 10.6382 |
| PAX-8 | small_intestine | 9.05912 |
| FREAC-7 | kidney | 9.00525 |
| TATA | kidney | 8.86963 |
| MRF-2 | small_intestine | 8.29276 |
| E4BP4 | uterus | 8.053 |
| RFX1 | pancreas | 7.85531 |
| NCX | brain | 7.77416 |
| NKX6-1 | small_intestine | 7.72188 |
| FAC1 | mammary_gland | 7.62381 |
| DBP | small_intestine | 7.57291 |
| TEF-1 | small_intestine | 7.30756 |
| NKX6-2 | small_intestine | 7.09658 |
| C-REL | small_intestine | 7.06934 |
| CDP_CR3 | larynx | 7.06864 |
| NKX6-1 | uterus | 7.01333 |
| GATA-4 | small_intestine | 6.6955 |
| POU3F2 | small_intestine | 6.63716 |
| NKX6-2 | thymus | 6.62703 |
| C/EBP | small_intestine | 6.62162 |
| HNF-6 | kidney | 6.49405 |
| STAT6 | brain | 6.49315 |
| AREB6 | small_intestine | 6.47875 |
| ATF | tongue | 6.4556 |
| IRF1 | small_intestine | 6.38511 |
| SMAD-3 | brain | 6.36657 |
| TFIIA | small_intestine | 6.32614 |
| OCT-1 | kidney | 6.32537 |
| HMG_IY | small_intestine | 6.26346 |
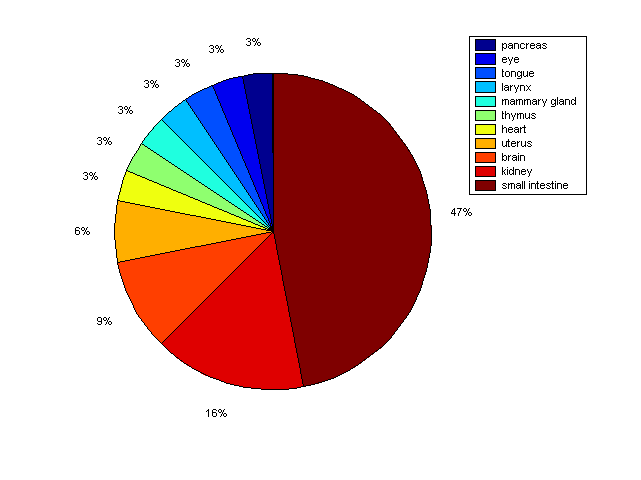
Distribution of Co-regulatory TFs
|
|
|
Description: this pie chart displays the distribution of co-regulatory transcription factors (TFs) in different tissues. Color schema: the tissue with the largest percentage of co-regulatory TFs is colored dark red whereas the tissue with the smallest percentage of co-regulatory TFs is colored dark blue. Tissues with intermediate percentages of co-regulatory TFs are colored from light red to yellow and cyan and then to light blue. |