Summary Table (Download Table)
| Co-regulatory TF | Tissue | -log(P) |
  | | |
| WHN | small_intestine | 16.2429 |
| LHX3 | small_intestine | 15.8236 |
| HNF-1 | small_intestine | 11.541 |
| TEF | brain | 11.4827 |
| COUP-TF/HNF-4 | small_intestine | 11.1556 |
| SRY | peripheral_nervous_system | 10.8122 |
| AFP1 | brain | 10.3731 |
| OCT-1 | small_intestine | 10.0509 |
| TATA | small_intestine | 9.98013 |
| HMG_IY | heart | 9.97115 |
| MEF-2 | heart | 9.56678 |
| HNF-1 | peripheral_nervous_system | 9.55928 |
| TCF-4 | small_intestine | 9.00303 |
| MYOD | peripheral_nervous_system | 8.82749 |
| NR2E3 | small_intestine | 8.5275 |
| ATF | peripheral_nervous_system | 8.48369 |
| ATF-1 | peripheral_nervous_system | 7.59482 |
| IPF1 | small_intestine | 7.50651 |
| PBX-1 | small_intestine | 7.41644 |
| EF-C | small_intestine | 7.17873 |
| E12 | brain | 7.12228 |
| C/EBP | small_intestine | 7.04972 |
| FOXJ2 | bone_marrow | 6.96589 |
| MYOD | brain | 6.86299 |
| HNF-3ALPHA | small_intestine | 6.81384 |
| PPARG | kidney | 6.76534 |
| FAC1 | peripheral_nervous_system | 6.62141 |
| MRF-2 | brain | 6.56889 |
| PBX1B | pancreas | 6.49058 |
| TEF-1 | small_intestine | 6.45915 |
| C/EBPBETA | peripheral_nervous_system | 6.45005 |
| E4BP4 | brain | 6.4283 |
| FOXJ2 | brain | 6.42647 |
| AHR/ARNT | mammary_gland | 6.42185 |
| FOXD3 | small_intestine | 6.39606 |
| HNF-3ALPHA | mammary_gland | 6.28684 |
| FREAC-4 | stomach | 6.27022 |
| STAT1 | mammary_gland | 6.18806 |
| STAT4 | peripheral_nervous_system | 6.18632 |
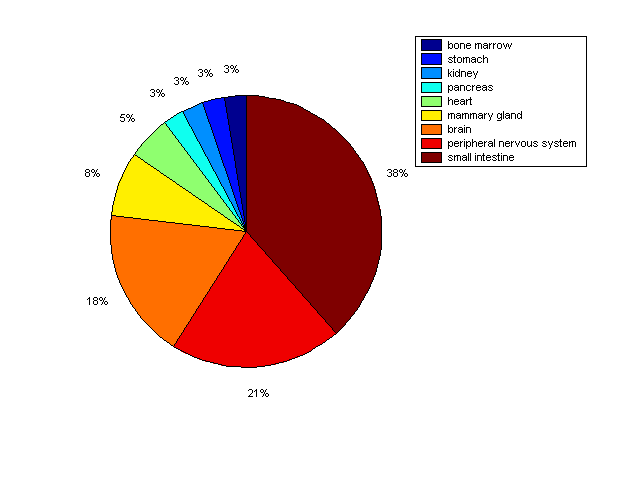
Distribution of Co-regulatory TFs
|
|
|
Description: this pie chart displays the distribution of co-regulatory transcription factors (TFs) in different tissues. Color schema: the tissue with the largest percentage of co-regulatory TFs is colored dark red whereas the tissue with the smallest percentage of co-regulatory TFs is colored dark blue. Tissues with intermediate percentages of co-regulatory TFs are colored from light red to yellow and cyan and then to light blue. |