Summary Table (Download Table)
| Co-regulatory TF | Tissue | -log(P) |
  | | |
| RSRFC4 | muscle | 15.3058 |
| MEF-2 | muscle | 14.0764 |
| NF-KAPPAB_(P65) | spleen | 11.7611 |
| PBX-1 | brain | 11.0131 |
| OCT-1 | kidney | 10.7028 |
| GATA-1 | brain | 9.63826 |
| RREB-1 | peripheral_nervous_system | 9.40527 |
| NF-KAPPAB | spleen | 9.3147 |
| AML-1A | brain | 8.66782 |
| AML1 | brain | 8.66782 |
| PBX1B | brain | 8.34231 |
| TATA | muscle | 7.97763 |
| TCF-4 | brain | 7.9537 |
| AMEF-2 | muscle | 7.6037 |
| MEIS1 | soft_tissue | 7.2624 |
| CDP_CR3 | muscle | 7.17875 |
| NCX | testis | 7.12855 |
| ATF3 | peripheral_nervous_system | 7.10304 |
| COUP-TF/HNF-4 | brain | 7.09761 |
| ETF | larynx | 6.98069 |
| ZID | kidney | 6.95585 |
| NRSF | brain | 6.72573 |
| IRF-7 | brain | 6.69294 |
| P53 | larynx | 6.56345 |
| MIF-1 | brain | 6.55411 |
| EF-C | brain | 6.4686 |
| CREB | tongue | 6.4385 |
| SP1 | brain | 6.3645 |
| GATA-6 | heart | 6.21816 |
| TFIIA | placenta | 6.21658 |
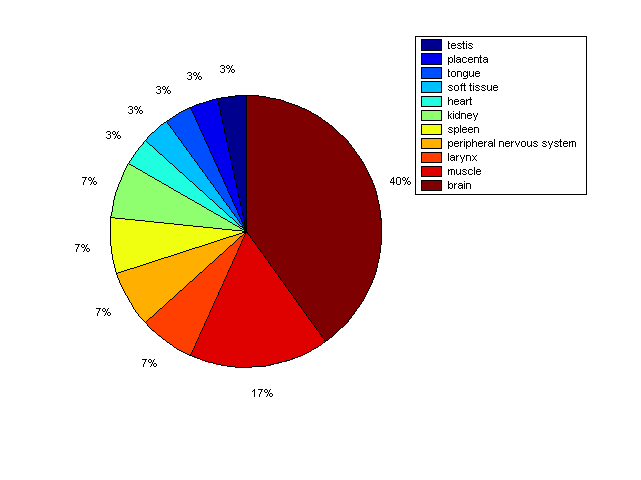
Distribution of Co-regulatory TFs
|
|
|
Description: this pie chart displays the distribution of co-regulatory transcription factors (TFs) in different tissues. Color schema: the tissue with the largest percentage of co-regulatory TFs is colored dark red whereas the tissue with the smallest percentage of co-regulatory TFs is colored dark blue. Tissues with intermediate percentages of co-regulatory TFs are colored from light red to yellow and cyan and then to light blue. |