Summary Table (Download Table)
| Co-regulatory TF | Tissue | -log(P) |
  | | |
| LHX3 | prostate | 21.3865 |
| HNF-1 | liver | 17.5108 |
| TEF | muscle | 15.561 |
| CDP_CR3+HD | muscle | 14.5188 |
| FOXO4 | soft_tissue | 13.3326 |
| FOXO1 | soft_tissue | 12.0096 |
| C/EBPBETA | liver | 11.7979 |
| SRY | soft_tissue | 11.617 |
| HFH-3 | kidney | 11.1633 |
| POU3F2 | uterus | 9.64567 |
| NKX6-2 | kidney | 9.60417 |
| C/EBPGAMMA | kidney | 9.22994 |
| OSF2 | blood | 9.13346 |
| OCT-1 | uterus | 8.78082 |
| TATA | soft_tissue | 8.44017 |
| ELK-1 | bone_marrow | 8.27889 |
| TATA | lung | 8.20189 |
| USF | muscle | 8.05711 |
| NCX | testis | 8.01441 |
| CART-1 | kidney | 7.73491 |
| NKX2-2 | soft_tissue | 7.60902 |
| NR2E3 | kidney | 7.59509 |
| FOXJ2 | bone | 7.5547 |
| PAX-8 | uterus | 7.52743 |
| E4F1 | bone | 7.38659 |
| OCT-1 | brain | 7.36324 |
| AMEF-2 | soft_tissue | 6.62983 |
| HNF-3ALPHA | soft_tissue | 6.60831 |
| CHX10 | kidney | 6.50408 |
| MRF-2 | kidney | 6.43152 |
| CDP | blood | 6.20737 |
| IPF1 | blood | 6.18655 |
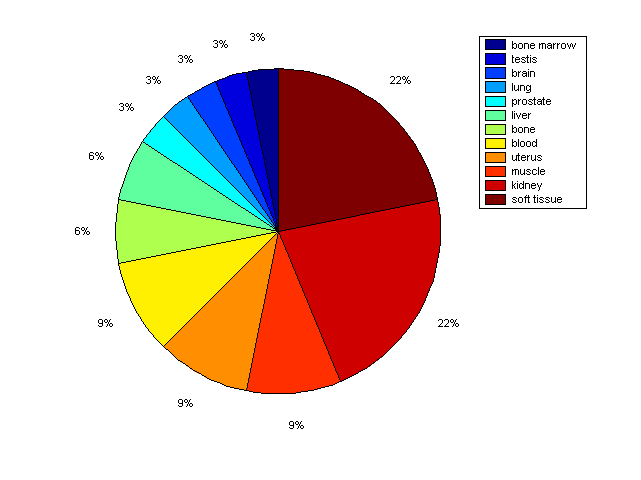
Distribution of Co-regulatory TFs
|
|
|
Description: this pie chart displays the distribution of co-regulatory transcription factors (TFs) in different tissues. Color schema: the tissue with the largest percentage of co-regulatory TFs is colored dark red whereas the tissue with the smallest percentage of co-regulatory TFs is colored dark blue. Tissues with intermediate percentages of co-regulatory TFs are colored from light red to yellow and cyan and then to light blue. |