Summary Table (Download Table)
| Co-regulatory TF | Tissue | -log(P) |
  | | |
| TBP | brain | 21.1491 |
| OCT-1 | brain | 15.4501 |
| CDP_CR3+HD | brain | 14.9529 |
| FREAC-7 | brain | 13.2985 |
| TCF11/MAFG | brain | 12.9388 |
| TAL-1ALPHA/E47 | brain | 11.9007 |
| NRL | brain | 11.3341 |
| IPF1 | brain | 11.293 |
| POU3F2 | peripheral_nervous_system | 11.2731 |
| TAL-1BETA/E47 | brain | 11.2587 |
| CREB | brain | 11.1018 |
| HLF | brain | 10.6441 |
| HNF-1 | kidney | 10.404 |
| ARP-1 | brain | 10.2232 |
| MIF-1 | brain | 10.1116 |
| FOXD3 | brain | 9.94411 |
| TATA | kidney | 9.88422 |
| SOX-9 | brain | 9.60515 |
| LHX3 | placenta | 9.28959 |
| FREAC-3 | liver | 9.28756 |
| C-MYC/MAX | brain | 9.24962 |
| MRF-2 | brain | 9.06002 |
| PAX-6 | kidney | 9.00525 |
| CRX | pancreas | 8.73462 |
| OCT-1 | peripheral_nervous_system | 8.52083 |
| OCT-1 | liver | 8.49439 |
| LXR | ovary | 8.14706 |
| MYOD | peripheral_nervous_system | 8.14475 |
| FREAC-3 | skin | 8.07665 |
| FOXO4 | liver | 7.88225 |
| LMO2_COMPLEX | lung | 7.87236 |
| NKX6-2 | skin | 7.86112 |
| FREAC-4 | brain | 7.83255 |
| FOXO1 | liver | 7.82467 |
| C/EBPBETA | brain | 7.65459 |
| GCNF | brain | 7.38102 |
| HFH-3 | liver | 7.05548 |
| AP-2GAMMA | lung | 7.0471 |
| TEF | kidney | 6.93994 |
| HNF-1 | skin | 6.90668 |
| NKX6-2 | peripheral_nervous_system | 6.87152 |
| OCT-1 | bone | 6.85979 |
| POU3F2 | muscle | 6.85391 |
| HMG_IY | brain | 6.81494 |
| FOXJ2 | bone | 6.80174 |
| CART-1 | peripheral_nervous_system | 6.76182 |
| HNF-1 | liver | 6.74929 |
| AP-1 | kidney | 6.64798 |
| HFH-3 | bladder | 6.61569 |
| STAT4 | placenta | 6.5786 |
| NKX6-2 | kidney | 6.57812 |
| C/EBP | bone | 6.56249 |
| POU1F1 | bone | 6.48288 |
| MZF1 | lung | 6.45441 |
| CHOP-C/EBPALPHA | brain | 6.43987 |
| GATA-1 | peripheral_nervous_system | 6.43794 |
| BACH1 | bladder | 6.38456 |
| POU3F2 | skin | 6.30635 |
| OCT-1 | kidney | 6.29266 |
| PAX-3 | brain | 6.26055 |
| HNF-1 | lung | 6.20302 |
| TEF | skin | 6.18781 |
| POU1F1 | peripheral_nervous_system | 6.17247 |
| C/EBP | brain | 6.1658 |
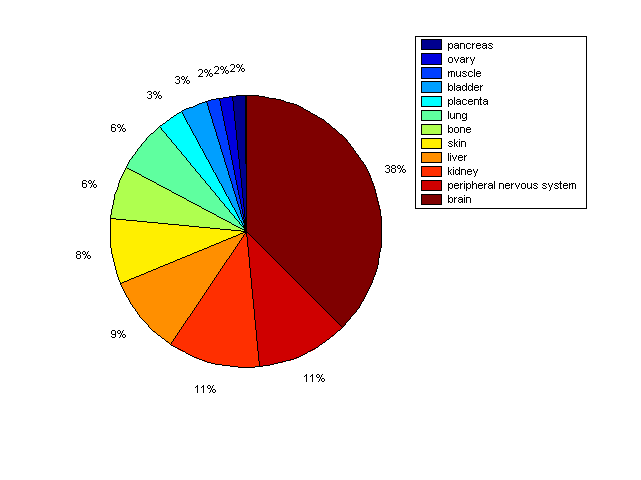
Distribution of Co-regulatory TFs
|
|
|
Description: this pie chart displays the distribution of co-regulatory transcription factors (TFs) in different tissues. Color schema: the tissue with the largest percentage of co-regulatory TFs is colored dark red whereas the tissue with the smallest percentage of co-regulatory TFs is colored dark blue. Tissues with intermediate percentages of co-regulatory TFs are colored from light red to yellow and cyan and then to light blue. |