Summary Table (Download Table)
| Co-regulatory TF | Tissue | -log(P) |
  | | |
| USF | brain | 6.16828 |
| HAND1/E47 | bone_marrow | 6.1786 |
| FAC1 | small_intestine | 6.18164 |
| LBP-1 | eye | 6.23491 |
| C-MYC/MAX | testis | 6.25205 |
| CRX | uterus | 6.25462 |
| SMAD-3 | lung | 6.25967 |
| C-MYC/MAX | larynx | 6.27556 |
| LHX3 | lung | 6.27585 |
| AP-2REP | kidney | 6.29595 |
| FREAC-3 | small_intestine | 6.31605 |
| C-ETS-1 | thymus | 6.33146 |
| C-MYC/MAX | tongue | 6.35021 |
| SP1 | brain | 6.37107 |
| TST-1 | ovary | 6.39842 |
| LMO2_COMPLEX | ovary | 6.41493 |
| ALX-4 | muscle | 6.41628 |
| IPF1 | small_intestine | 6.45033 |
| IRF1 | larynx | 6.47041 |
| PAX-6 | small_intestine | 6.47875 |
| P53 | small_intestine | 6.47927 |
| NF-KAPPAB_(P65) | tongue | 6.48333 |
| AMEF-2 | brain | 6.49311 |
| OCT-1 | skin | 6.49811 |
| ATF | pancreas | 6.50167 |
| PITX2 | muscle | 6.50618 |
| GATA-1 | skin | 6.53143 |
| ALX-4 | small_intestine | 6.56752 |
| NRF-1 | bladder | 6.58813 |
| XBP-1 | heart | 6.59721 |
| USF | testis | 6.62307 |
| NRSF | pancreas | 6.62414 |
| MYOD | stomach | 6.64947 |
| HNF-4ALPHA | stomach | 6.69522 |
| NF-1 | testis | 6.70341 |
| ALPHA-CP1 | larynx | 6.72832 |
| OSF2 | brain | 6.73015 |
| E47 | larynx | 6.76183 |
| NERF1A | brain | 6.78552 |
| GATA-6 | skin | 6.80204 |
| BACH2 | stomach | 6.8184 |
| C/EBP | kidney | 6.82202 |
| NKX6-2 | small_intestine | 6.87167 |
| GR | skin | 6.87932 |
| AP-1 | larynx | 6.88341 |
| OCT-1 | brain | 6.89333 |
| C-ETS-2 | lymph_node | 6.90224 |
| STAT3 | stomach | 6.93124 |
| STAT4 | spleen | 6.94912 |
| SMAD-3 | cervix | 6.95311 |
| RFX1 | pancreas | 6.95669 |
| EGR-3 | ovary | 6.97068 |
| C-ETS-1 | lymph_node | 6.97588 |
| PPARG | kidney | 6.98599 |
| MAZR | pancreas | 6.99446 |
| NF-KAPPAB_(P65) | muscle | 7.05473 |
| VDR | peripheral_nervous_system | 7.08224 |
| SP1 | ovary | 7.10075 |
| USF | larynx | 7.1392 |
| ELK-1 | larynx | 7.14096 |
| TEF-1 | skin | 7.14248 |
| OCT-1 | kidney | 7.19265 |
| AREB6 | bladder | 7.19766 |
| HOXA4 | larynx | 7.22604 |
| CRX | prostate | 7.23102 |
| NF-KAPPAB | tongue | 7.25812 |
| TEF | brain | 7.26292 |
| HNF-1 | colon | 7.26293 |
| AP-1 | stomach | 7.26764 |
| PU.1 | larynx | 7.29311 |
| GR | muscle | 7.30457 |
| E4BP4 | heart | 7.3116 |
| OCT-X | larynx | 7.31513 |
| E12 | pancreas | 7.31676 |
| GATA-1 | tongue | 7.40929 |
| AREB6 | stomach | 7.42227 |
| OCT-1 | heart | 7.48707 |
| COUP-TF/HNF-4 | small_intestine | 7.51429 |
| MYOD | pancreas | 7.54566 |
| MEIS1 | skin | 7.56139 |
| TFII-I | ovary | 7.62907 |
| SRY | small_intestine | 7.63721 |
| BACH1 | stomach | 7.64229 |
| SOX-9 | heart | 7.64639 |
| ALPHA-CP1 | tongue | 7.64653 |
| NF-KAPPAB_(P50) | stomach | 7.65265 |
| NF-KAPPAB | heart | 7.71636 |
| AREB6 | pancreas | 7.78069 |
| LBP-1 | soft_tissue | 7.79913 |
| MEIS1 | pancreas | 7.8527 |
| ICSBP | lymph_node | 7.87295 |
| NF-E2 | eye | 7.9449 |
| RREB-1 | larynx | 7.98328 |
| GABP | stomach | 8.33977 |
| HNF-1 | small_intestine | 8.38324 |
| GATA-4 | brain | 8.40338 |
| STAT3 | small_intestine | 8.4255 |
| GCM | skin | 8.44325 |
| HEB | eye | 8.45399 |
| CART-1 | small_intestine | 8.48577 |
| USF | small_intestine | 8.61051 |
| NF-E2 | stomach | 8.72517 |
| TST-1 | brain | 8.76053 |
| E47 | pancreas | 8.79415 |
| AFP1 | kidney | 8.81306 |
| GABP | larynx | 8.89614 |
| NF-KAPPAB | muscle | 8.98974 |
| LUN-1 | spleen | 9.00739 |
| LBP-1 | spleen | 9.03166 |
| ATF4 | skin | 9.17142 |
| GATA-1 | pancreas | 9.27013 |
| ISRE | larynx | 9.29171 |
| MZF1 | small_intestine | 9.31862 |
| STAT5A | larynx | 9.36187 |
| MEF-2 | heart | 9.45724 |
| SP1 | pancreas | 9.48468 |
| ISRE | lymph_node | 9.59743 |
| AREB6 | ovary | 9.73528 |
| SREBP-1 | bladder | 9.79692 |
| NR2E3 | kidney | 10.1775 |
| ATF | tongue | 10.2028 |
| E12 | skin | 10.257 |
| NRF-1 | ovary | 10.3969 |
| HNF-4 | kidney | 10.5151 |
| SREBP-1 | skin | 11.0569 |
| MYOD | skin | 11.3039 |
| TATA | muscle | 11.3895 |
| MAZR | small_intestine | 11.4258 |
| NERF1A | larynx | 11.6158 |
| VDR | skin | 11.777 |
| HNF-4ALPHA | kidney | 11.9258 |
| AHR/ARNT | pancreas | 11.9821 |
| ETF | small_intestine | 12.4798 |
| RSRFC4 | muscle | 12.6964 |
| COUP-TF/HNF-4 | kidney | 14.9496 |
| TFIIA | skin | 15.1089 |
| SMAD-3 | brain | 15.6966 |
| C-MYC/MAX | small_intestine | 15.8947 |
| HNF-1 | kidney | 15.9071 |
| ALX-4 | skin | 17.2672 |
| ARP-1 | skin | 17.3264 |
| MEF-2 | muscle | 17.3886 |
| E47 | skin | 27.0891 |
| AREB6 | skin | 36.4025 |
| LMO2_COMPLEX | skin | 47.5044 |
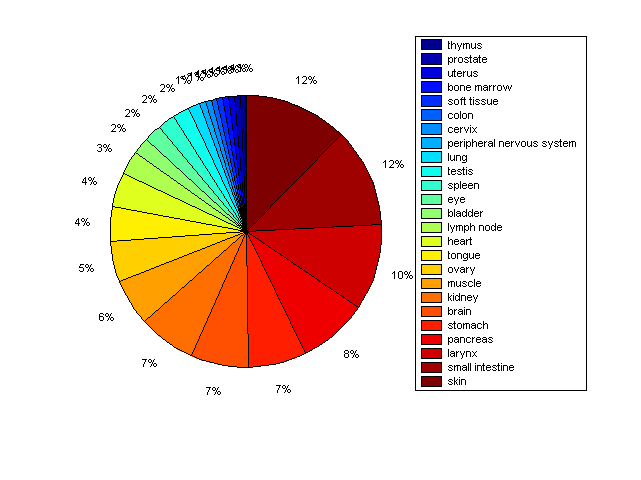
Distribution of Co-regulatory TFs
|
|
|
Description: this pie chart displays the distribution of co-regulatory transcription factors (TFs) in different tissues. Color schema: the tissue with the largest percentage of co-regulatory TFs is colored dark red whereas the tissue with the smallest percentage of co-regulatory TFs is colored dark blue. Tissues with intermediate percentages of co-regulatory TFs are colored from light red to yellow and cyan and then to light blue. |