Summary Table (Download Table)
| Co-regulatory TF | Tissue | -log(P) |
  | | |
| SREBP-1 | small_intestine | 12.7962 |
| USF | small_intestine | 12.2049 |
| USF2 | small_intestine | 11.8711 |
| NRF-1 | cervix | 11.3393 |
| C-MYC/MAX | small_intestine | 10.8985 |
| ARNT | small_intestine | 10.6868 |
| ETF | blood | 10.6488 |
| SP1 | larynx | 9.85192 |
| ELK-1 | testis | 9.60029 |
| ATF6 | small_intestine | 9.32932 |
| AREB6 | larynx | 8.89614 |
| NRF-1 | bone_marrow | 8.87223 |
| LUN-1 | small_intestine | 8.8447 |
| E2F-4/DP-2 | tongue | 8.73446 |
| AREB6 | stomach | 8.33977 |
| NRF-1 | larynx | 8.28596 |
| MAX | small_intestine | 8.19891 |
| ELK-1 | bone_marrow | 8.19777 |
| ELK-1 | small_intestine | 8.16714 |
| NRF-1 | testis | 7.78676 |
| NF-Y | tongue | 7.7666 |
| PEA3 | blood | 7.5369 |
| MEIS1 | larynx | 7.4824 |
| PU.1 | blood | 7.44825 |
| AP-2 | larynx | 7.34425 |
| ELK-1 | bladder | 7.33096 |
| PEA3 | testis | 7.08268 |
| PAX-3 | tongue | 7.03278 |
| EGR-2 | tongue | 6.94335 |
| E2F-4/DP-1 | testis | 6.903 |
| SP1 | tongue | 6.86321 |
| NRF-1 | tongue | 6.84949 |
| HIF-1 | tongue | 6.84642 |
| E4F1 | bone_marrow | 6.75848 |
| E2F | testis | 6.74807 |
| E2F-1 | soft_tissue | 6.73343 |
| USF | larynx | 6.612 |
| ATF6 | larynx | 6.53557 |
| E2F-1 | thymus | 6.52788 |
| C-MYC/MAX | larynx | 6.44074 |
| ETF | bone | 6.39772 |
| ETF | larynx | 6.31479 |
| STAT1 | bladder | 6.26469 |
| ELK-1 | tongue | 6.25222 |
| GABP | testis | 6.22662 |
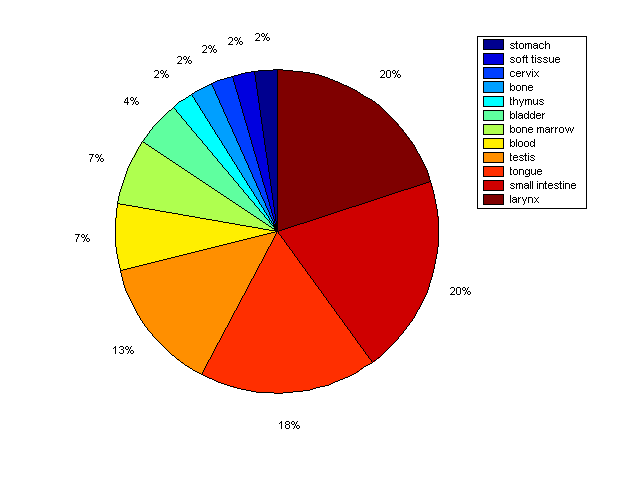
Distribution of Co-regulatory TFs
|
|
|
Description: this pie chart displays the distribution of co-regulatory transcription factors (TFs) in different tissues. Color schema: the tissue with the largest percentage of co-regulatory TFs is colored dark red whereas the tissue with the smallest percentage of co-regulatory TFs is colored dark blue. Tissues with intermediate percentages of co-regulatory TFs are colored from light red to yellow and cyan and then to light blue. |