Summary Table (Download Table)
| Co-regulatory TF | Tissue | -log(P) |
  | | |
| FREAC-3 | brain | 13.0137 |
| NF-Y | eye | 11.4723 |
| HNF-3ALPHA | brain | 11.1889 |
| FAC1 | brain | 10.9367 |
| GATA-6 | heart | 10.4561 |
| HFH-3 | brain | 10.4507 |
| TEF | brain | 10.4102 |
| SREBP-1 | muscle | 10.1912 |
| FOXJ2 | brain | 10.1896 |
| POU3F2 | brain | 9.91918 |
| C/EBPBETA | brain | 9.85842 |
| FREAC-7 | brain | 9.60515 |
| MEF-2 | muscle | 9.43744 |
| TCF-4 | brain | 9.08439 |
| FOXD3 | brain | 8.449 |
| E4BP4 | brain | 8.39831 |
| MEF-2 | brain | 8.2905 |
| FOXO4 | brain | 8.08072 |
| HAND1/E47 | brain | 7.98365 |
| CREB | eye | 7.95095 |
| HLF | bone_marrow | 7.82816 |
| TAL-1ALPHA/E47 | brain | 7.79352 |
| TEF-1 | heart | 7.76649 |
| AREB6 | heart | 7.64639 |
| PAX-3 | uterus | 7.57971 |
| USF | muscle | 7.53518 |
| ERR_ALPHA | brain | 7.50927 |
| STAT6 | brain | 7.37488 |
| GR | heart | 7.28343 |
| AMEF-2 | brain | 6.91462 |
| E4BP4 | uterus | 6.84346 |
| OCT-1 | brain | 6.84173 |
| CDP | skin | 6.72907 |
| PPARG | uterus | 6.57493 |
| MAX | muscle | 6.55256 |
| OCT-1 | heart | 6.49548 |
| HEB | muscle | 6.42365 |
| FOXJ2 | small_intestine | 6.41109 |
| USF | thymus | 6.3638 |
| POU3F2 | thymus | 6.34754 |
| STAT5A | brain | 6.31456 |
| TAL-1BETA/ITF-2 | brain | 6.24367 |
| NR2E3 | eye | 6.21769 |
| TGIF | eye | 6.19818 |
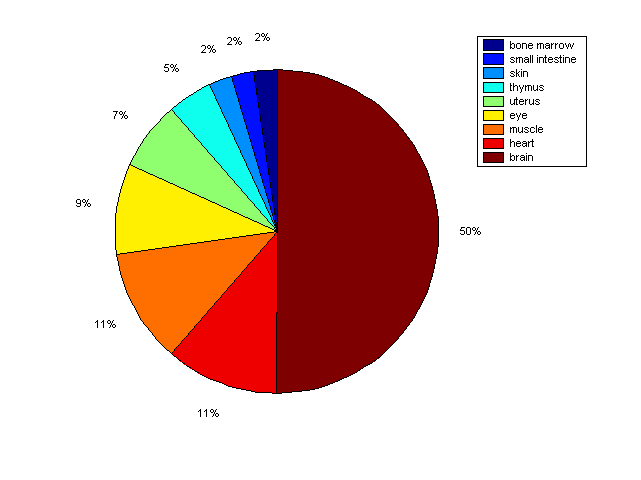
Distribution of Co-regulatory TFs
|
|
|
Description: this pie chart displays the distribution of co-regulatory transcription factors (TFs) in different tissues. Color schema: the tissue with the largest percentage of co-regulatory TFs is colored dark red whereas the tissue with the smallest percentage of co-regulatory TFs is colored dark blue. Tissues with intermediate percentages of co-regulatory TFs are colored from light red to yellow and cyan and then to light blue. |