Summary Table (Download Table)
| Co-regulatory TF | Tissue | -log(P) |
  | | |
| SREBP-1 | bladder | 23.1682 |
| USF | bladder | 12.5507 |
| HNF-1 | kidney | 12.2796 |
| CHOP-C/EBPALPHA | brain | 12.2546 |
| MAX | bladder | 11.839 |
| LHX3 | placenta | 11.5993 |
| YY1 | heart | 10.9644 |
| ARNT | bladder | 10.7997 |
| SREBP-1 | kidney | 10.6512 |
| TGIF | muscle | 10.5903 |
| USF2 | bladder | 10.4096 |
| USF | kidney | 10.0028 |
| CREB | kidney | 9.41603 |
| LMO2_COMPLEX | brain | 9.27243 |
| RSRFC4 | heart | 9.25755 |
| C-MYC/MAX | bladder | 8.93937 |
| MYOD | muscle | 8.77421 |
| CRE-BP1 | kidney | 8.70626 |
| GATA-X | brain | 8.65622 |
| MEF-2 | heart | 8.42269 |
| CDP | kidney | 8.19994 |
| E4F1 | kidney | 8.10006 |
| OCT-1 | tongue | 8.07936 |
| CHX10 | placenta | 8.06478 |
| MEIS1 | muscle | 7.94689 |
| ATF6 | bone | 7.9432 |
| C/EBPBETA | muscle | 7.89394 |
| MEF-2 | muscle | 7.83683 |
| C/EBPBETA | brain | 7.66777 |
| NRF-1 | tongue | 7.66315 |
| ARNT | kidney | 7.60387 |
| FAC1 | tongue | 7.48561 |
| GCM | skin | 7.39634 |
| ATF | tongue | 7.21936 |
| GATA-1 | brain | 7.17917 |
| SREBP-1 | muscle | 6.98724 |
| USF | muscle | 6.93498 |
| GATA-1 | testis | 6.85089 |
| MEIS1B/HOXA9 | kidney | 6.74789 |
| USF | skin | 6.71377 |
| XBP-1 | kidney | 6.63228 |
| AREB6 | heart | 6.59721 |
| XBP-1 | heart | 6.51345 |
| RSRFC4 | muscle | 6.50594 |
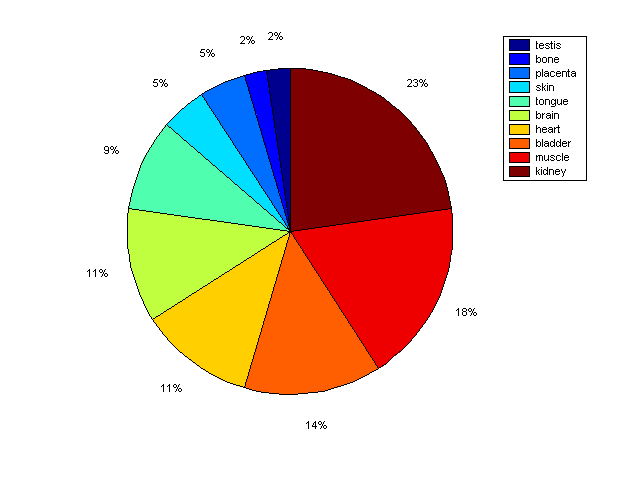
Distribution of Co-regulatory TFs
|
|
|
Description: this pie chart displays the distribution of co-regulatory transcription factors (TFs) in different tissues. Color schema: the tissue with the largest percentage of co-regulatory TFs is colored dark red whereas the tissue with the smallest percentage of co-regulatory TFs is colored dark blue. Tissues with intermediate percentages of co-regulatory TFs are colored from light red to yellow and cyan and then to light blue. |