Summary Table (Download Table)
| Co-regulatory TF | Tissue | -log(P) |
  | | |
| C-ETS-2 | lymph_node | 13.3883 |
| C-ETS-1 | lymph_node | 13.2548 |
| PU.1 | lymph_node | 12.7732 |
| ELF-1 | lymph_node | 12.3659 |
| LHX3 | small_intestine | 11.4003 |
| POU3F2 | small_intestine | 10.892 |
| TEL-2 | lymph_node | 10.5599 |
| SRY | brain | 10.1192 |
| HNF-3ALPHA | soft_tissue | 9.4818 |
| TEF-1 | soft_tissue | 9.28223 |
| FOXO3 | brain | 8.94721 |
| FOXO4 | blood | 8.80763 |
| SREBP-1 | lymph_node | 8.72195 |
| HNF-3ALPHA | brain | 8.67695 |
| OCT-1 | heart | 8.63166 |
| FOXO1 | soft_tissue | 8.55731 |
| FOXJ2 | colon | 8.47527 |
| ISRE | uterus | 8.43294 |
| PPARG | small_intestine | 8.2332 |
| E2F | heart | 8.13784 |
| STAT5A | brain | 8.07498 |
| AREB6 | lymph_node | 7.87295 |
| ER | small_intestine | 7.77709 |
| NF-AT | lymph_node | 7.63762 |
| NKX2-2 | brain | 7.60245 |
| TST-1 | heart | 7.58049 |
| LXR | heart | 7.4498 |
| GATA-1 | larynx | 7.26881 |
| TBP | small_intestine | 7.10015 |
| CDC5 | heart | 6.97603 |
| BRN-2 | bone_marrow | 6.92647 |
| E4BP4 | brain | 6.82172 |
| C/EBPDELTA | lymph_node | 6.81304 |
| ELK-1 | lymph_node | 6.75011 |
| FOXO4 | soft_tissue | 6.69263 |
| IRF-1 | uterus | 6.69019 |
| AHR/ARNT | ovary | 6.66956 |
| CHX10 | small_intestine | 6.66633 |
| IRF1 | soft_tissue | 6.59567 |
| IRF1 | heart | 6.52748 |
| BACH1 | lymph_node | 6.5067 |
| GATA-6 | heart | 6.38175 |
| STAT6 | lymph_node | 6.3798 |
| FXR | heart | 6.29072 |
| CART-1 | small_intestine | 6.19274 |
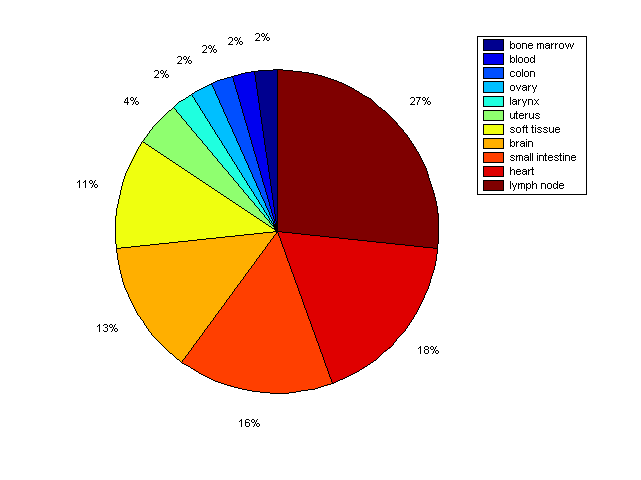
Distribution of Co-regulatory TFs
|
|
|
Description: this pie chart displays the distribution of co-regulatory transcription factors (TFs) in different tissues. Color schema: the tissue with the largest percentage of co-regulatory TFs is colored dark red whereas the tissue with the smallest percentage of co-regulatory TFs is colored dark blue. Tissues with intermediate percentages of co-regulatory TFs are colored from light red to yellow and cyan and then to light blue. |