Summary Table (Download Table)
| Co-regulatory TF | Tissue | -log(P) |
  | | |
| SREBP-1 | bladder | 14.5473 |
| MEF-2 | muscle | 12.1502 |
| CREB | tongue | 12.033 |
| ATF | tongue | 11.1848 |
| LHX3 | placenta | 11.0694 |
| MEF-2 | heart | 10.6365 |
| HNF-1 | kidney | 10.2505 |
| ATF | thymus | 10.1859 |
| AREB6 | skin | 9.17142 |
| ATF | kidney | 8.90504 |
| CREB | kidney | 8.76774 |
| CRE-BP1 | tongue | 8.15057 |
| SP1 | larynx | 7.89104 |
| MAX | bladder | 7.69388 |
| STAT1 | stomach | 7.29779 |
| CHX10 | placenta | 7.25302 |
| USF | bladder | 7.08735 |
| E2F-1/DP-2 | stomach | 7.06324 |
| PEA3 | stomach | 6.99082 |
| RSRFC4 | heart | 6.93349 |
| ARNT | bladder | 6.78013 |
| CRE-BP1 | kidney | 6.37091 |
| GCM | skin | 6.2851 |
| BACH2 | stomach | 6.2254 |
| PAX-2 | larynx | 6.19433 |
| TEF-1 | soft_tissue | 6.18695 |
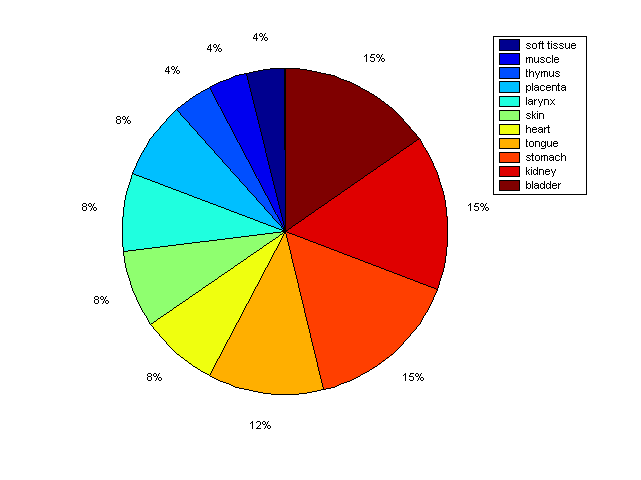
Distribution of Co-regulatory TFs
|
|
|
Description: this pie chart displays the distribution of co-regulatory transcription factors (TFs) in different tissues. Color schema: the tissue with the largest percentage of co-regulatory TFs is colored dark red whereas the tissue with the smallest percentage of co-regulatory TFs is colored dark blue. Tissues with intermediate percentages of co-regulatory TFs are colored from light red to yellow and cyan and then to light blue. |