Summary Table (Download Table)
| Co-regulatory TF | Tissue | -log(P) |
  | | |
| POU3F2 | small_intestine | 15.927 |
| FREAC-3 | brain | 14.1253 |
| C/EBPDELTA | lymph_node | 12.5076 |
| C-ETS-2 | lymph_node | 12.0935 |
| NF-AT | lymph_node | 11.8048 |
| FAC1 | lymph_node | 10.4902 |
| CHX10 | small_intestine | 10.0578 |
| STAT5A | brain | 9.78564 |
| AREB6 | lymph_node | 9.59743 |
| FOXO4 | blood | 9.44147 |
| AREB6 | larynx | 9.29171 |
| HFH-3 | brain | 9.09106 |
| TBP | small_intestine | 8.8022 |
| LHX3 | small_intestine | 8.57246 |
| ICSBP | uterus | 8.43294 |
| IRF-1 | uterus | 7.90369 |
| NKX6-2 | small_intestine | 7.76961 |
| CDC5 | brain | 7.10556 |
| SRY | brain | 6.6418 |
| AP-3 | bone | 6.60573 |
| STAT6 | lymph_node | 6.59909 |
| NRF-1 | small_intestine | 6.45549 |
| PPARG | muscle | 6.43991 |
| GATA-1 | larynx | 6.36869 |
| CART-1 | small_intestine | 6.28734 |
| ATF-1 | lymph_node | 6.23854 |
| TCF11 | lymph_node | 6.22124 |
| GR | larynx | 6.21114 |
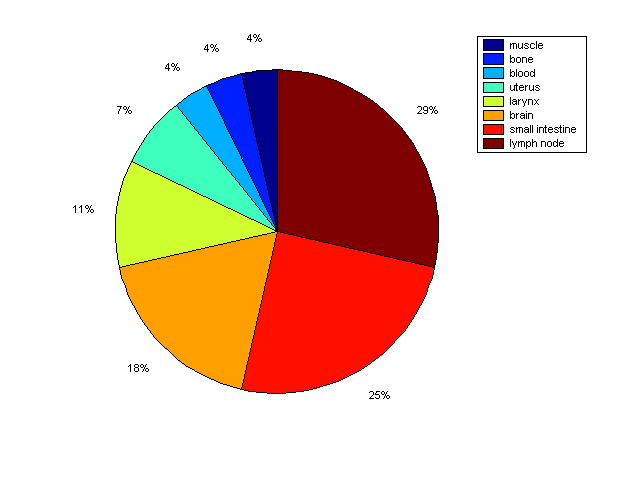
Distribution of Co-regulatory TFs
|
|
|
Description: this pie chart displays the distribution of co-regulatory transcription factors (TFs) in different tissues. Color schema: the tissue with the largest percentage of co-regulatory TFs is colored dark red whereas the tissue with the smallest percentage of co-regulatory TFs is colored dark blue. Tissues with intermediate percentages of co-regulatory TFs are colored from light red to yellow and cyan and then to light blue. |