Summary Table (Download Table)
| Co-regulatory TF | Tissue | -log(P) |
  | | |
| VDR | heart | 6.57727 |
| USF2 | muscle | 6.67077 |
| USF | thymus | 6.29409 |
| USF | muscle | 6.56472 |
| USF | blood | 6.25191 |
| TST-1 | peripheral_nervous_system | 6.67875 |
| TST-1 | brain | 6.28992 |
| TITF1 | small_intestine | 18.7042 |
| TEF | uterus | 10.044 |
| TEF | muscle | 8.76295 |
| TEF | heart | 19.3897 |
| TCF11/MAFG | thymus | 9.43818 |
| TCF11/MAFG | brain | 7.45159 |
| TBP | uterus | 6.22499 |
| TBP | small_intestine | 12.5544 |
| TBP | prostate | 6.41419 |
| TBP | peripheral_nervous_system | 19.9142 |
| TATA | placenta | 7.2106 |
| TATA | kidney | 8.03505 |
| TATA | heart | 10.3821 |
| STAT5B_(HOMODIMER) | blood | 9.5255 |
| STAT5A_(HOMOTETRAMER) | blood | 10.9779 |
| STAT5A_(HOMODIMER) | blood | 9.79248 |
| STAT5A | peripheral_nervous_system | 7.5476 |
| STAT4 | peripheral_nervous_system | 6.78132 |
| STAT1 | small_intestine | 6.32893 |
| STAT1 | bone_marrow | 6.31937 |
| SRF | uterus | 7.67881 |
| SRF | pancreas | 6.59327 |
| SOX-9 | thymus | 6.34754 |
| SOX-9 | brain | 9.91918 |
| RSRFC4 | small_intestine | 7.15278 |
| RSRFC4 | heart | 6.56639 |
| RREB-1 | heart | 13.2477 |
| RP58 | small_intestine | 6.41152 |
| RFX1 | small_intestine | 7.54383 |
| PU.1 | thymus | 6.84693 |
| POU3F2 | uterus | 8.94539 |
| POU3F2 | thymus | 8.15669 |
| POU3F2 | small_intestine | 7.98444 |
| POU3F2 | peripheral_nervous_system | 7.47851 |
| POU3F2 | eye | 10.3639 |
| POU1F1 | uterus | 14.3834 |
| POU1F1 | prostate | 7.7887 |
| POU1F1 | peripheral_nervous_system | 7.98685 |
| PITX2 | peripheral_nervous_system | 8.07753 |
| PBX-1 | small_intestine | 6.61344 |
| PBX-1 | brain | 13.056 |
| PAX-6 | small_intestine | 6.63716 |
| PAX-6 | heart | 11.2963 |
| OCT-1 | uterus | 12.1277 |
| OCT-1 | peripheral_nervous_system | 20.1959 |
| OCT-1 | pancreas | 7.09201 |
| OCT-1 | heart | 10.2203 |
| OCT-1 | eye | 6.32344 |
| OCT-1 | brain | 11.0981 |
| OCT-1 | bone | 11.1175 |
| NRF-1 | small_intestine | 7.32406 |
| NR2E3 | small_intestine | 6.55258 |
| NKX6-2 | uterus | 11.6021 |
| NKX6-2 | thymus | 8.31977 |
| NKX6-2 | small_intestine | 11.7198 |
| NKX6-2 | peripheral_nervous_system | 13.6013 |
| NKX6-1 | uterus | 9.92331 |
| NKX6-1 | thymus | 6.5129 |
| NKX6-1 | heart | 7.30674 |
| NKX6-1 | bone_marrow | 6.91493 |
| NKX3A | small_intestine | 8.3817 |
| NKX2-2 | kidney | 7.60357 |
| NF-Y | peripheral_nervous_system | 7.54046 |
| NF-KAPPAB_(P65) | bone | 8.24574 |
| NF-AT | small_intestine | 8.73447 |
| NF-1 | thymus | 8.895 |
| MRF-2 | prostate | 9.91354 |
| MIF-1 | small_intestine | 10.7725 |
| MIF-1 | heart | 8.2023 |
| MEIS1B/HOXA9 | small_intestine | 9.69707 |
| MEIS1B/HOXA9 | bladder | 6.94625 |
| MEIS1 | muscle | 8.10868 |
| MEIS1 | heart | 7.88682 |
| MEF-2 | muscle | 7.49487 |
| LHX3 | uterus | 7.20387 |
| LHX3 | small_intestine | 18.7377 |
| LHX3 | muscle | 6.67571 |
| LHX3 | lymph_node | 7.33449 |
| ISRE | small_intestine | 15.927 |
| IRF1 | small_intestine | 13.5347 |
| IRF1 | heart | 14.7902 |
| IPF1 | small_intestine | 6.47392 |
| IPF1 | peripheral_nervous_system | 12.9638 |
| ICSBP | small_intestine | 10.892 |
| HSF2 | peripheral_nervous_system | 8.66709 |
| HSF2 | brain | 6.54554 |
| HSF1 | peripheral_nervous_system | 7.33483 |
| HNF-6 | peripheral_nervous_system | 15.115 |
| HNF-4ALPHA | liver | 7.31602 |
| HNF-3ALPHA | eye | 6.93376 |
| HNF-3ALPHA | brain | 7.55527 |
| HNF-1 | small_intestine | 18.5937 |
| HNF-1 | prostate | 7.71085 |
| HNF-1 | eye | 6.62484 |
| HMG_IY | lymph_node | 6.16096 |
| HFH-3 | peripheral_nervous_system | 14.7003 |
| GR | small_intestine | 7.94582 |
| GR | heart | 10.3069 |
| GCNF | small_intestine | 6.50134 |
| GCNF | colon | 7.45478 |
| GATA-X | small_intestine | 7.74755 |
| GATA-X | kidney | 7.17599 |
| GATA-1 | small_intestine | 6.39512 |
| GATA-1 | peripheral_nervous_system | 10.8939 |
| FREAC-7 | skin | 6.30635 |
| FREAC-7 | peripheral_nervous_system | 11.2731 |
| FREAC-7 | muscle | 6.85391 |
| FREAC-4 | testis | 7.29533 |
| FREAC-3 | peripheral_nervous_system | 7.32573 |
| FREAC-3 | heart | 15.3897 |
| FOXO4 | small_intestine | 8.10052 |
| FOXO1 | uterus | 8.64892 |
| FOXJ2 | peripheral_nervous_system | 6.97362 |
| FOXJ2 | heart | 25.0683 |
| FOXJ2 | eye | 39.9539 |
| FOXD3 | heart | 16.1128 |
| FOXD3 | bone | 6.77552 |
| ERR_ALPHA | small_intestine | 7.02637 |
| ER | placenta | 13.8783 |
| ELK-1 | skin | 6.69154 |
| E4BP4 | uterus | 14.3329 |
| E4BP4 | thymus | 6.44419 |
| E4BP4 | small_intestine | 6.37955 |
| E4BP4 | heart | 7.38249 |
| E47 | thymus | 7.46563 |
| E2F | small_intestine | 8.87476 |
| DBP | small_intestine | 6.26163 |
| CRX | prostate | 7.15041 |
| CRX | liver | 7.42921 |
| CRX | blood | 6.68448 |
| CRX | bladder | 6.79008 |
| CREB | tongue | 7.2476 |
| COUP-TF/HNF-4 | small_intestine | 11.3879 |
| CHX10 | blood | 10.1873 |
| CHOP-C/EBPALPHA | peripheral_nervous_system | 7.78004 |
| CDP_CR3 | small_intestine | 8.88556 |
| CDP_CR3 | muscle | 6.29951 |
| CDP | uterus | 7.68342 |
| CDP | stomach | 6.32409 |
| CDP | small_intestine | 8.97229 |
| CDP | placenta | 6.22015 |
| CDP | peripheral_nervous_system | 7.46585 |
| CDP | brain | 10.9604 |
| CDC5 | testis | 9.60538 |
| CDC5 | lymph_node | 7.45742 |
| CART-1 | prostate | 7.44586 |
| CART-1 | peripheral_nervous_system | 12.7441 |
| CART-1 | liver | 6.30519 |
| C/EBPGAMMA | uterus | 9.64567 |
| C/EBPBETA | peripheral_nervous_system | 7.04549 |
| C/EBPALPHA | peripheral_nervous_system | 6.89989 |
| C/EBP | small_intestine | 8.44004 |
| C/EBP | peripheral_nervous_system | 7.84128 |
| C/EBP | heart | 6.98306 |
| C/EBP | brain | 9.92841 |
| C-REL | small_intestine | 8.87607 |
| C-MYB | eye | 6.19999 |
| ARNT | muscle | 6.91185 |
| AP-4 | thymus | 6.59909 |
| AP-1 | heart | 8.5752 |
| AMEF-2 | peripheral_nervous_system | 8.29906 |
| ALX-4 | uterus | 7.69055 |
| ALPHA-CP1 | peripheral_nervous_system | 9.1915 |
| AFP1 | peripheral_nervous_system | 9.52749 |
| AFP1 | pancreas | 6.91873 |
| AFP1 | brain | 8.1429 |
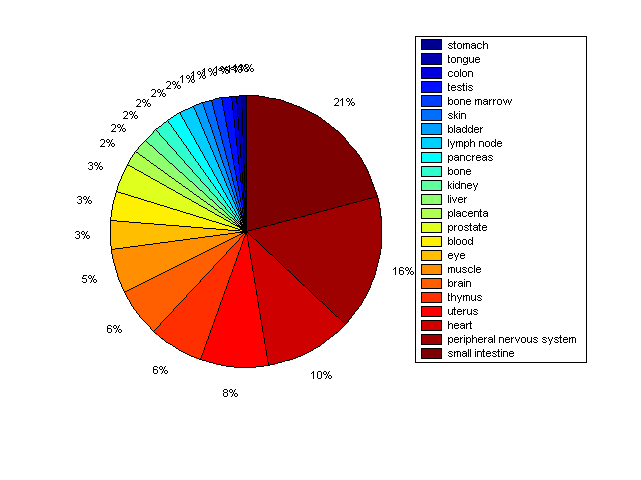
Distribution of Co-regulatory TFs
|
|
|
Description: this pie chart displays the distribution of co-regulatory transcription factors (TFs) in different tissues. Color schema: the tissue with the largest percentage of co-regulatory TFs is colored dark red whereas the tissue with the smallest percentage of co-regulatory TFs is colored dark blue. Tissues with intermediate percentages of co-regulatory TFs are colored from light red to yellow and cyan and then to light blue. |