Summary Table (Download Table)
| Co-regulatory TF | Tissue | -log(P) |
  | | |
| IPF1 | peripheral_nervous_system | 9.89434 |
| SRY | peripheral_nervous_system | 9.42773 |
| ATF | pancreas | 8.8093 |
| RSRFC4 | muscle | 8.26283 |
| CDP | peripheral_nervous_system | 7.36461 |
| FAC1 | bone_marrow | 7.34428 |
| PITX2 | muscle | 7.26919 |
| TFIIA | placenta | 7.01654 |
| HNF-3ALPHA | peripheral_nervous_system | 6.85934 |
| MZF1 | ovary | 6.70577 |
| MAZ | ovary | 6.65988 |
| AP-3 | skin | 6.64618 |
| POU3F2 | small_intestine | 6.41152 |
| FAC1 | peripheral_nervous_system | 6.3619 |
| PPARG | muscle | 6.35104 |
| AP-1 | eye | 6.23095 |
| FXR | liver | 6.20728 |
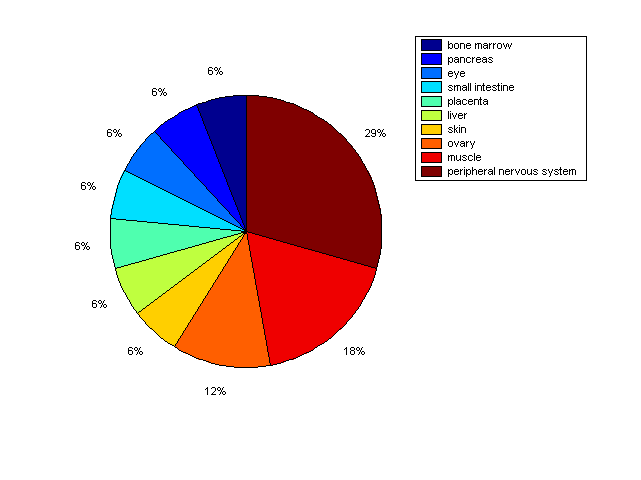
Distribution of Co-regulatory TFs
|
|
|
Description: this pie chart displays the distribution of co-regulatory transcription factors (TFs) in different tissues. Color schema: the tissue with the largest percentage of co-regulatory TFs is colored dark red whereas the tissue with the smallest percentage of co-regulatory TFs is colored dark blue. Tissues with intermediate percentages of co-regulatory TFs are colored from light red to yellow and cyan and then to light blue. |