Summary Table (Download Table)
| Co-regulatory TF | Tissue | -log(P) |
  |   |   |
| CHX10 | eye | 16.2563 |
| POU3F2 | peripheral_nervous_system | 15.115 |
| HNF-1 | liver | 13.4557 |
| CDC5 | kidney | 11.743 |
| TBP | peripheral_nervous_system | 11.6975 |
| OCT-1 | peripheral_nervous_system | 11.4777 |
| CDP | colon | 10.312 |
| OCT-1 | eye | 9.79019 |
| TBP | small_intestine | 9.74632 |
| AFP1 | colon | 9.59281 |
| C/EBP | brain | 9.56774 |
| HNF-1 | peripheral_nervous_system | 9.4445 |
| NF-Y | eye | 9.32397 |
| MRF-2 | colon | 9.00144 |
| STAT1 | thymus | 8.89569 |
| NKX3A | peripheral_nervous_system | 8.23029 |
| RSRFC4 | heart | 7.95584 |
| TCF11/MAFG | bone_marrow | 7.91229 |
| TCF-4 | kidney | 7.77237 |
| TITF1 | eye | 7.66175 |
| MYOGENIN/NF-1 | eye | 7.37624 |
| MEF-2 | kidney | 7.34859 |
| FOXJ2 | blood | 7.31961 |
| BRN-2 | peripheral_nervous_system | 7.21509 |
| STAT1 | bone_marrow | 7.20512 |
| CART-1 | kidney | 7.1871 |
| STAT5A | brain | 7.1634 |
| OCT-1 | colon | 7.1332 |
| POU1F1 | kidney | 7.0256 |
| HNF-1 | small_intestine | 6.95101 |
| OCT-1 | bone | 6.89339 |
| NKX6-2 | peripheral_nervous_system | 6.77332 |
| PEA3 | thymus | 6.75662 |
| RORALPHA1 | eye | 6.74287 |
| PAX-6 | kidney | 6.49405 |
| AML-1A | colon | 6.43552 |
| AML1 | colon | 6.43552 |
| AFP1 | heart | 6.41244 |
| SREBP-1 | peripheral_nervous_system | 6.40268 |
| HFH-3 | peripheral_nervous_system | 6.32733 |
| C/EBPALPHA | brain | 6.24982 |
| USF | thymus | 6.19726 |
| TITF1 | heart | 6.18282 |
| FREAC-3 | peripheral_nervous_system | 6.16441 |
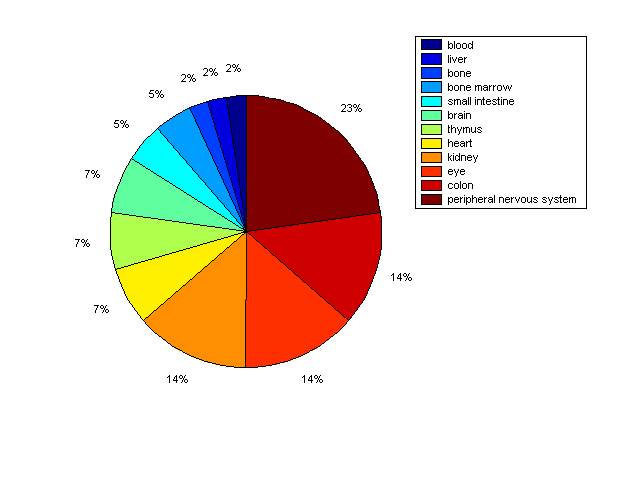
Distribution of Co-regulatory TFs
|
|
|
Description: this pie chart displays the distribution of co-regulatory transcription factors (TFs) in different tissues. Color schema: the tissue with the largest percentage of co-regulatory TFs is colored dark red whereas the tissue with the smallest percentage of co-regulatory TFs is colored dark blue. Tissues with intermediate percentages of co-regulatory TFs are colored from light red to yellow and cyan and then to light blue. |
