Summary Table (Download Table)
| Co-regulatory TF | Tissue | -log(P) |
  | | |
| E4BP4 | tongue | 6.97612 |
| STAT1 | thymus | 6.28028 |
| PEA3 | thymus | 7.58292 |
| HLF | thymus | 7.79276 |
| C-ETS-2 | thymus | 9.03134 |
| C-ETS-1 | thymus | 10.1103 |
| SF-1 | testis | 6.9141 |
| TEF-1 | soft_tissue | 6.86402 |
| NF-KAPPAB_(P65) | soft_tissue | 7.09042 |
| NF-KAPPAB | soft_tissue | 6.25222 |
| LHX3 | soft_tissue | 7.77535 |
| WHN | small_intestine | 9.36894 |
| TITF1 | small_intestine | 9.96129 |
| TEF | small_intestine | 6.40818 |
| TBP | small_intestine | 14.1371 |
| TATA | small_intestine | 7.37724 |
| SOX-9 | small_intestine | 6.41109 |
| RREB-1 | small_intestine | 6.4139 |
| PBX-1 | small_intestine | 7.40871 |
| PAX-2 | small_intestine | 8.48735 |
| OCT-1 | small_intestine | 6.82802 |
| NR2E3 | small_intestine | 8.16241 |
| LHX3 | small_intestine | 13.5108 |
| HNF-3ALPHA | small_intestine | 6.72381 |
| FREAC-3 | small_intestine | 7.23379 |
| COUP-TF/HNF-4 | small_intestine | 8.36198 |
| FREAC-3 | skin | 7.85583 |
| LHX3 | prostate | 13.242 |
| FAC1 | placenta | 6.68501 |
| POU3F2 | peripheral_nervous_system | 6.97362 |
| POU1F1 | peripheral_nervous_system | 7.89984 |
| LHX3 | peripheral_nervous_system | 6.57661 |
| HNF-1 | peripheral_nervous_system | 10.7108 |
| CREB | peripheral_nervous_system | 6.52839 |
| SRF | pancreas | 7.32637 |
| CDP | pancreas | 6.26751 |
| TCF11 | muscle | 6.96461 |
| SREBP-1 | muscle | 9.38485 |
| C/EBPALPHA | muscle | 6.16611 |
| HEB | mammary_gland | 6.19471 |
| E4F1 | lung | 7.3151 |
| HNF-1 | liver | 8.56844 |
| NF-KAPPAB_(P65) | larynx | 6.49971 |
| PITX2 | kidney | 7.9513 |
| HNF-1 | kidney | 10.5203 |
| FOXO4 | kidney | 6.67814 |
| CDC5 | kidney | 12.1664 |
| TEF | heart | 8.39102 |
| STAT4 | heart | 6.61576 |
| RREB-1 | heart | 7.07302 |
| POU3F2 | heart | 25.0683 |
| OCT-X | heart | 9.70123 |
| OCT-1 | heart | 7.14561 |
| NF-E2 | heart | 6.7114 |
| MEF-2 | heart | 8.38523 |
| IRF1 | heart | 7.62364 |
| GR | heart | 8.15855 |
| TAX/CREB | eye | 7.64769 |
| PPARALPHA/RXR-ALPHA | eye | 9.68177 |
| POU3F2 | eye | 39.9539 |
| PBX1B | eye | 7.71774 |
| PAX-8 | eye | 10.8232 |
| PAX-6 | eye | 10.6382 |
| PAX-3 | eye | 6.30839 |
| PAX-2 | eye | 14.9791 |
| OCT-1 | eye | 20.6056 |
| NR2E3 | eye | 17.007 |
| NKX3A | eye | 6.30382 |
| MEF-2 | eye | 6.44396 |
| IRF-7 | eye | 8.10908 |
| HNF-1 | eye | 10.1324 |
| FXR | eye | 6.34719 |
| FOXO4 | eye | 6.88875 |
| FOXJ2 | eye | 20.8575 |
| CREB | eye | 11.01 |
| CRE-BP1/C-JUN | eye | 12.2948 |
| ATF | eye | 12.1186 |
| AFP1 | eye | 10.6679 |
| OCT-1 | colon | 10.6914 |
| IRF1 | colon | 7.61362 |
| ICSBP | colon | 8.47527 |
| HNF-4ALPHA | colon | 7.39955 |
| HNF-1 | colon | 10.6824 |
| CDP | colon | 6.20251 |
| ALX-4 | colon | 6.79373 |
| SMAD-3 | cervix | 7.01483 |
| TBP | brain | 7.56884 |
| STAT6 | brain | 8.86538 |
| STAT5A | brain | 9.00329 |
| SRY | brain | 9.17528 |
| SRF | brain | 9.24697 |
| SOX-9 | brain | 10.1896 |
| RORALPHA2 | brain | 9.81389 |
| OCT-X | brain | 7.0381 |
| OCT-1 | brain | 6.48051 |
| NKX6-2 | brain | 9.01336 |
| MRF-2 | brain | 8.87759 |
| LHX3 | brain | 7.204 |
| HFH-4 | brain | 6.42647 |
| GCNF | brain | 7.64302 |
| GATA-6 | brain | 7.05742 |
| FOXO4 | brain | 6.40208 |
| CREB | brain | 8.16877 |
| CHX10 | brain | 7.61744 |
| CART-1 | brain | 10.3413 |
| C/EBP | brain | 9.68386 |
| BRN-2 | brain | 9.02825 |
| ATF-1 | brain | 6.40726 |
| OSF2 | bone_marrow | 7.73291 |
| MEF-2 | bone_marrow | 7.45792 |
| HFH-4 | bone_marrow | 6.96589 |
| GR | bone_marrow | 6.36814 |
| ELF-1 | bone_marrow | 10.2304 |
| RSRFC4 | bone | 7.93008 |
| POU1F1 | bone | 6.27815 |
| PAX-2 | bone | 7.56541 |
| OCT-1 | bone | 6.51614 |
| MEF-2 | bone | 7.39705 |
| HSF2 | bone | 6.91434 |
| HSF | bone | 8.63622 |
| GR | bone | 6.30902 |
| FREAC-7 | bone | 6.80174 |
| FOXO4 | bone | 7.4734 |
| FOXO3 | bone | 12.6202 |
| FOXO1 | bone | 10.0246 |
| FOXJ2 | bone | 10.6663 |
| ELF-1 | bone | 7.8306 |
| C/EBPGAMMA | bone | 7.5547 |
| C/EBP | bone | 6.86258 |
| AP-3 | bone | 16.5794 |
| TEL-2 | blood | 8.16972 |
| STAT5A_(HOMOTETRAMER) | blood | 8.26728 |
| RSRFC4 | blood | 6.65136 |
| PU.1 | blood | 6.85751 |
| HNF-6 | blood | 7.31961 |
| HNF-1 | blood | 12.2792 |
| GATA-6 | blood | 6.54359 |
| FXR | blood | 6.48548 |
| FOXO4 | blood | 11.4768 |
| FOXJ2 | blood | 8.35559 |
| ELK-1 | blood | 10.7843 |
| ELF-1 | blood | 15.2215 |
| CRX | blood | 7.90129 |
| C-ETS-2 | blood | 10.221 |
| C-ETS-1 | blood | 10.1553 |
| AMEF-2 | blood | 7.81625 |
| IRF-1 | bladder | 6.93856 |
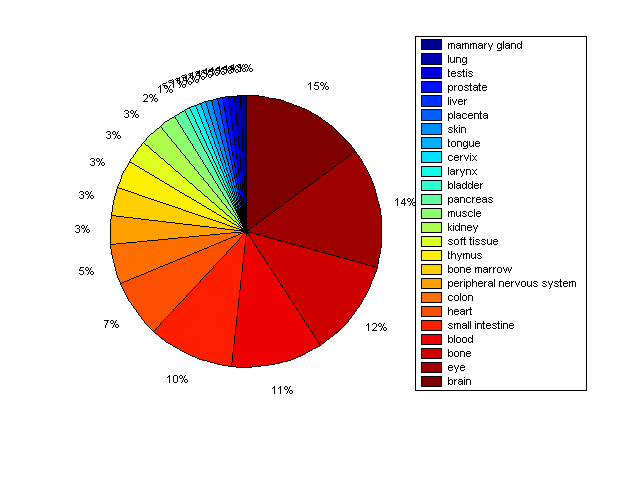
Distribution of Co-regulatory TFs
|
|
|
Description: this pie chart displays the distribution of co-regulatory transcription factors (TFs) in different tissues. Color schema: the tissue with the largest percentage of co-regulatory TFs is colored dark red whereas the tissue with the smallest percentage of co-regulatory TFs is colored dark blue. Tissues with intermediate percentages of co-regulatory TFs are colored from light red to yellow and cyan and then to light blue. |