Summary Table (Download Table)
| Co-regulatory TF | Tissue | -log(P) |
  | | |
| NF-Y | small_intestine | 21.6913 |
| MEF-2 | larynx | 9.71156 |
| ELF-1 | lymph_node | 8.32845 |
| ISRE | uterus | 7.90369 |
| GATA-4 | small_intestine | 7.65818 |
| C/EBPALPHA | small_intestine | 7.61037 |
| HFH-3 | peripheral_nervous_system | 7.29609 |
| NKX6-2 | small_intestine | 7.27749 |
| FREAC-3 | colon | 7.24738 |
| C/EBP | small_intestine | 7.1979 |
| AR | thymus | 7.1175 |
| FOXJ2 | bladder | 6.93856 |
| NF-KAPPAB_(P65) | bladder | 6.93585 |
| LMO2_COMPLEX | tongue | 6.89743 |
| HMG_IY | soft_tissue | 6.83465 |
| TBP | small_intestine | 6.78977 |
| C/EBPBETA | muscle | 6.73258 |
| ZID | brain | 6.69797 |
| ICSBP | uterus | 6.69019 |
| GATA-1 | bladder | 6.62733 |
| SMAD-3 | brain | 6.54619 |
| RSRFC4 | larynx | 6.49978 |
| ATF | pancreas | 6.3539 |
| LUN-1 | colon | 6.34815 |
| CHX10 | larynx | 6.30757 |
| ATF-1 | brain | 6.25365 |
| ALX-4 | soft_tissue | 6.24715 |
| C/EBP | muscle | 6.24709 |
| COUP-TF/HNF-4 | small_intestine | 6.17928 |
| MIF-1 | small_intestine | 6.17563 |
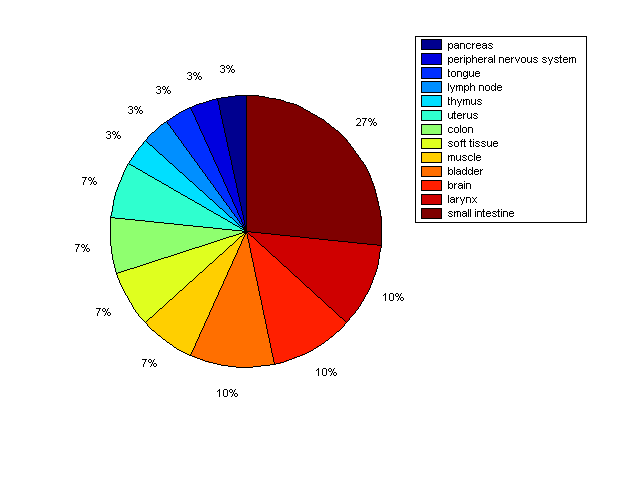
Distribution of Co-regulatory TFs
|
|
|
Description: this pie chart displays the distribution of co-regulatory transcription factors (TFs) in different tissues. Color schema: the tissue with the largest percentage of co-regulatory TFs is colored dark red whereas the tissue with the smallest percentage of co-regulatory TFs is colored dark blue. Tissues with intermediate percentages of co-regulatory TFs are colored from light red to yellow and cyan and then to light blue. |