Summary Table (Download Table)
| Co-regulatory TF | Tissue | -log(P) |
  | | |
| PU.1 | blood | 21.0319 |
| PEA3 | blood | 16.1045 |
| ELF-1 | blood | 15.3055 |
| HNF-1 | kidney | 11.327 |
| C-ETS-1 | blood | 10.8705 |
| ICSBP | lymph_node | 10.5599 |
| PEA3 | bone_marrow | 9.2984 |
| FOXJ2 | blood | 8.16972 |
| ELK-1 | bone_marrow | 7.99961 |
| ELK-1 | blood | 7.56019 |
| AP-4 | spleen | 7.54689 |
| C-ETS-2 | blood | 7.20372 |
| PU.1 | spleen | 7.19531 |
| AP-1 | blood | 6.98997 |
| USF | small_intestine | 6.93021 |
| STAT1 | lymph_node | 6.90302 |
| STAT1 | blood | 6.84199 |
| PPARALPHA/RXR-ALPHA | blood | 6.76318 |
| FREAC-3 | skin | 6.71216 |
| EF-C | bone | 6.70015 |
| SP1 | larynx | 6.62078 |
| ELK-1 | testis | 6.55101 |
| TEL-2 | blood | 6.53786 |
| PU.1 | thymus | 6.46932 |
| C/EBPBETA | soft_tissue | 6.45163 |
| ELF-1 | bone_marrow | 6.44436 |
| PEA3 | stomach | 6.41795 |
| C-MYC/MAX | small_intestine | 6.34834 |
| NRF-1 | bone_marrow | 6.34162 |
| GCM | larynx | 6.26661 |
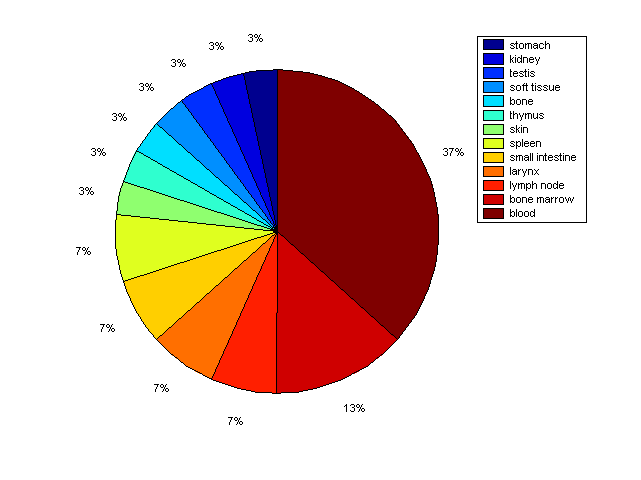
Distribution of Co-regulatory TFs
|
|
|
Description: this pie chart displays the distribution of co-regulatory transcription factors (TFs) in different tissues. Color schema: the tissue with the largest percentage of co-regulatory TFs is colored dark red whereas the tissue with the smallest percentage of co-regulatory TFs is colored dark blue. Tissues with intermediate percentages of co-regulatory TFs are colored from light red to yellow and cyan and then to light blue. |