Summary Table (Download Table)
| Co-regulatory TF | Tissue | -log(P) |
  | | |
| SREBP-1 | bladder | 17.2885 |
| MAX | bladder | 13.0884 |
| OCT-1 | small_intestine | 12.1167 |
| CDP | brain | 11.4943 |
| USF2 | bladder | 11.3331 |
| HOXA4 | larynx | 10.8743 |
| ARNT | bladder | 10.8301 |
| FOXJ2 | eye | 10.8232 |
| USF | bladder | 10.6573 |
| RSRFC4 | soft_tissue | 10.0714 |
| TBP | soft_tissue | 9.36892 |
| C-MYC/MAX | bladder | 9.18648 |
| PAX-6 | small_intestine | 9.05912 |
| TEF-1 | small_intestine | 8.91096 |
| HMG_IY | larynx | 8.88029 |
| OCT-1 | kidney | 8.87808 |
| HNF-4ALPHA | kidney | 8.79986 |
| NCX | brain | 8.61283 |
| COUP-TF/HNF-4 | soft_tissue | 8.57572 |
| HNF-1 | kidney | 8.15579 |
| NR2E3 | small_intestine | 8.04426 |
| ATF | thymus | 8.01895 |
| ATF | tongue | 8.01216 |
| ETF | tongue | 7.81467 |
| OCT-1 | uterus | 7.7346 |
| YY1 | heart | 7.72635 |
| OSF2 | muscle | 7.68905 |
| NR2E3 | soft_tissue | 7.66394 |
| SMAD-3 | larynx | 7.64365 |
| DBP | small_intestine | 7.54366 |
| C/EBPGAMMA | uterus | 7.52743 |
| NF-Y | blood | 7.3439 |
| OCT-1 | pancreas | 7.34252 |
| IRF1 | small_intestine | 7.25896 |
| ZID | larynx | 6.99178 |
| MEF-2 | soft_tissue | 6.84489 |
| GATA-4 | small_intestine | 6.82157 |
| EF-C | brain | 6.77029 |
| NRF-1 | tongue | 6.52435 |
| CDP | kidney | 6.51228 |
| GATA-X | kidney | 6.49095 |
| E2F | brain | 6.36678 |
| NF-Y | kidney | 6.2889 |
| TEF | eye | 6.28616 |
| OSF2 | bone | 6.26966 |
| AP-3 | kidney | 6.25453 |
| TEF-1 | larynx | 6.19762 |
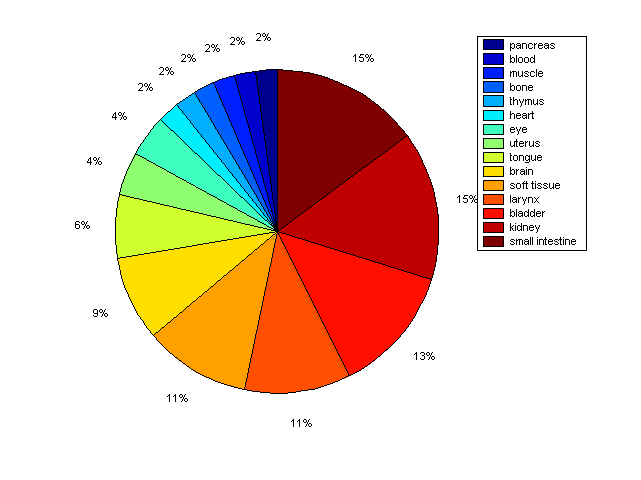
Distribution of Co-regulatory TFs
|
|
|
Description: this pie chart displays the distribution of co-regulatory transcription factors (TFs) in different tissues. Color schema: the tissue with the largest percentage of co-regulatory TFs is colored dark red whereas the tissue with the smallest percentage of co-regulatory TFs is colored dark blue. Tissues with intermediate percentages of co-regulatory TFs are colored from light red to yellow and cyan and then to light blue. |