Summary Table (Download Table)
| Co-regulatory TF | Tissue | -log(P) |
  | | |
| HNF-1 | liver | 11.894 |
| FREAC-7 | brain | 10.6441 |
| STAT1 | bone_marrow | 9.39918 |
| GR | bone_marrow | 9.36982 |
| C/EBP | brain | 9.04491 |
| USF | bone_marrow | 8.94029 |
| TEF | bone_marrow | 8.7737 |
| NKX6-1 | brain | 8.35941 |
| ALX-4 | muscle | 8.27415 |
| SOX-9 | bone_marrow | 7.82816 |
| FOXJ2 | thymus | 7.79276 |
| NF-Y | muscle | 7.76217 |
| HNF-3ALPHA | brain | 7.47208 |
| HFH-3 | brain | 6.94933 |
| FOXD3 | brain | 6.91626 |
| CDP_CR1 | lung | 6.78962 |
| TBP | brain | 6.75852 |
| CDC5 | bone | 6.72215 |
| CREB | bone | 6.69047 |
| SRY | bone_marrow | 6.65324 |
| CHX10 | bone_marrow | 6.56475 |
| NRL | uterus | 6.52733 |
| NKX6-2 | kidney | 6.47829 |
| MRF-2 | bone | 6.37479 |
| FOXO3 | bone | 6.26168 |
| NR2E3 | kidney | 6.19384 |
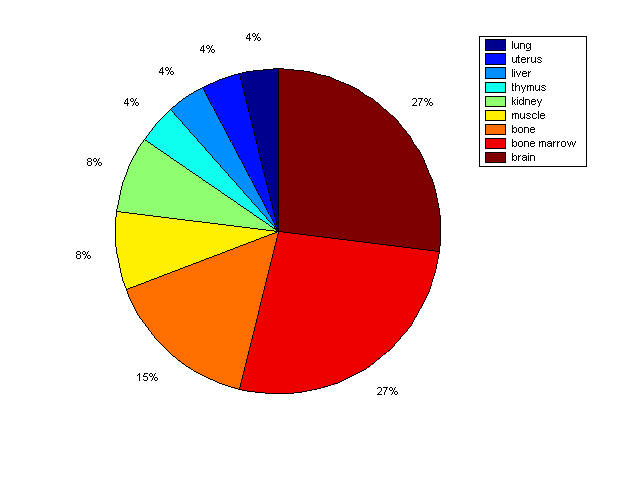
Distribution of Co-regulatory TFs
|
|
|
Description: this pie chart displays the distribution of co-regulatory transcription factors (TFs) in different tissues. Color schema: the tissue with the largest percentage of co-regulatory TFs is colored dark red whereas the tissue with the smallest percentage of co-regulatory TFs is colored dark blue. Tissues with intermediate percentages of co-regulatory TFs are colored from light red to yellow and cyan and then to light blue. |