Summary Table (Download Table)
| Co-regulatory TF | Tissue | -log(P) |
  | | |
| POU3F2 | uterus | 7.68342 |
| POU3F2 | stomach | 6.32409 |
| TBP | spleen | 6.38152 |
| RSRFC4 | spleen | 10.1163 |
| TCF11 | soft_tissue | 6.95432 |
| SF-1 | soft_tissue | 7.38993 |
| RORALPHA1 | soft_tissue | 6.76442 |
| OSF2 | soft_tissue | 6.74815 |
| WHN | small_intestine | 7.46455 |
| TEF | small_intestine | 7.18678 |
| SRY | small_intestine | 7.10754 |
| POU3F2 | small_intestine | 8.97229 |
| PBX-1 | small_intestine | 7.51139 |
| NR2E3 | small_intestine | 7.86957 |
| NKX6-2 | small_intestine | 9.72127 |
| NF-AT | small_intestine | 7.4568 |
| MRF-2 | small_intestine | 6.65644 |
| MIF-1 | small_intestine | 7.43566 |
| LHX3 | small_intestine | 17.2252 |
| HNF-1 | small_intestine | 6.67268 |
| HFH-3 | small_intestine | 6.78202 |
| EF-C | small_intestine | 8.15907 |
| CART-1 | small_intestine | 6.45335 |
| C/EBP | small_intestine | 7.69168 |
| SRY | skin | 7.29602 |
| SOX-9 | skin | 6.72907 |
| TGIF | placenta | 7.28186 |
| POU3F2 | placenta | 6.22015 |
| PAX-2 | placenta | 7.58097 |
| LHX3 | placenta | 8.95015 |
| GATA-6 | placenta | 6.57362 |
| FAC1 | placenta | 7.03414 |
| CHX10 | placenta | 6.7773 |
| BSAP | placenta | 6.2435 |
| TBP | peripheral_nervous_system | 8.6508 |
| SRY | peripheral_nervous_system | 7.69111 |
| RREB-1 | peripheral_nervous_system | 7.69987 |
| RP58 | peripheral_nervous_system | 7.36461 |
| PPAR | peripheral_nervous_system | 7.13559 |
| POU3F2 | peripheral_nervous_system | 7.46585 |
| NKX3A | peripheral_nervous_system | 7.75214 |
| NF-Y | peripheral_nervous_system | 11.8604 |
| IPF1 | peripheral_nervous_system | 9.37501 |
| HSF2 | peripheral_nervous_system | 8.89687 |
| GATA-1 | peripheral_nervous_system | 7.44175 |
| FAC1 | peripheral_nervous_system | 10.713 |
| E47 | peripheral_nervous_system | 7.25338 |
| BRN-2 | peripheral_nervous_system | 6.84917 |
| ALPHA-CP1 | peripheral_nervous_system | 10.2478 |
| HFH-3 | pancreas | 7.17594 |
| FOXJ2 | pancreas | 6.26751 |
| TITF1 | muscle | 7.91604 |
| TEF | muscle | 12.7476 |
| PBX-1 | muscle | 8.07573 |
| OCT-1 | muscle | 8.2344 |
| HSF1 | muscle | 7.96982 |
| GR | muscle | 6.88856 |
| CRX | muscle | 6.40465 |
| CDP_CR3+HD | muscle | 10.5 |
| CDP_CR1 | muscle | 6.8821 |
| C/EBPBETA | muscle | 12.9793 |
| C/EBPALPHA | muscle | 13.9631 |
| C/EBP | muscle | 13.2431 |
| ALX-4 | muscle | 8.72179 |
| TBP | mammary_gland | 7.95906 |
| TATA | mammary_gland | 7.88807 |
| SMAD-3 | mammary_gland | 8.32647 |
| RSRFC4 | mammary_gland | 10.9986 |
| MEF-2 | mammary_gland | 7.13928 |
| MRF-2 | lung | 8.75249 |
| STATX | liver | 6.62887 |
| HNF-4ALPHA | liver | 11.5469 |
| HNF-3ALPHA | liver | 6.57739 |
| HNF-1 | liver | 20.9496 |
| COUP-TF/HNF-4 | liver | 7.55889 |
| ARP-1 | liver | 6.6417 |
| XBP-1 | kidney | 8.19994 |
| PAX-8 | kidney | 6.51228 |
| E4BP4 | kidney | 8.48062 |
| PBX-1 | heart | 7.5574 |
| NKX6-2 | heart | 7.55406 |
| MIF-1 | heart | 6.21448 |
| MEF-2 | heart | 6.63234 |
| LMO2_COMPLEX | heart | 6.37965 |
| GATA-6 | heart | 14.4875 |
| GATA-1 | heart | 8.60131 |
| E2F | heart | 6.46737 |
| AP-1 | heart | 7.14317 |
| TEF | eye | 6.3566 |
| RORALPHA1 | eye | 6.99747 |
| OCT-1 | eye | 8.88712 |
| GATA-1 | eye | 10.2419 |
| CRX | eye | 6.64335 |
| CHX10 | eye | 18.0681 |
| C/EBP | eye | 8.13094 |
| TST-1 | colon | 6.97487 |
| TEF | colon | 8.5249 |
| TBP | colon | 13.2869 |
| TATA | colon | 12.177 |
| SF-1 | colon | 6.3718 |
| OCT-X | colon | 9.54774 |
| OCT-1 | colon | 12.6139 |
| NKX6-1 | colon | 11.6957 |
| MRF-2 | colon | 15.673 |
| IRF1 | colon | 8.68698 |
| HNF-6 | colon | 10.312 |
| HNF-3ALPHA | colon | 6.55167 |
| HNF-1 | colon | 17.3554 |
| HFH-3 | colon | 7.62228 |
| GCNF | colon | 11.6473 |
| FOXO4 | colon | 18.5433 |
| FOXJ2 | colon | 6.20251 |
| CDP | colon | 7.53143 |
| ALX-4 | colon | 13.8605 |
| AFP1 | colon | 15.1635 |
| TST-1 | brain | 14.9481 |
| TAL-1ALPHA/E47 | brain | 8.3426 |
| STAT6 | brain | 7.31129 |
| SRF | brain | 6.35253 |
| POU3F2 | brain | 10.9604 |
| PAX-8 | brain | 11.4943 |
| OCT-1 | brain | 11.464 |
| NRSF | brain | 8.00621 |
| GCM | brain | 7.6992 |
| GATA-6 | brain | 6.42948 |
| E4BP4 | brain | 11.9341 |
| CDC5 | brain | 6.33709 |
| C/EBPALPHA | brain | 6.98435 |
| NKX6-2 | blood | 17.6386 |
| ELF-1 | blood | 6.29595 |
| CART-1 | blood | 6.35295 |
| C/EBPGAMMA | blood | 6.20737 |
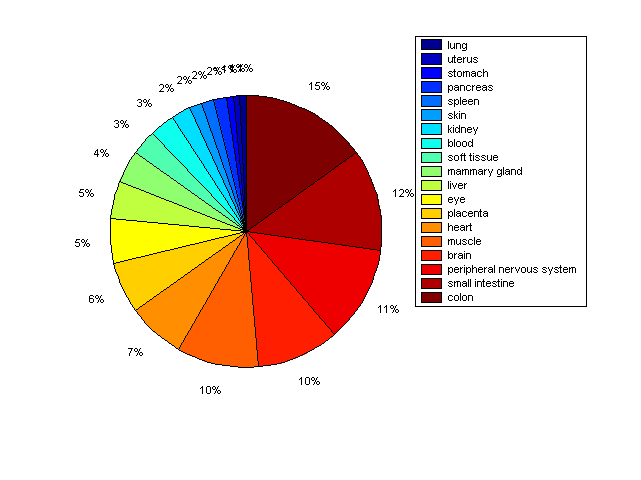
Distribution of Co-regulatory TFs
|
|
|
Description: this pie chart displays the distribution of co-regulatory transcription factors (TFs) in different tissues. Color schema: the tissue with the largest percentage of co-regulatory TFs is colored dark red whereas the tissue with the smallest percentage of co-regulatory TFs is colored dark blue. Tissues with intermediate percentages of co-regulatory TFs are colored from light red to yellow and cyan and then to light blue. |