Summary Table (Download Table)
| Co-regulatory TF | Tissue | -log(P) |
  | | |
| BACH2 | tongue | 10.2764 |
| CDP_CR3+HD | muscle | 9.89534 |
| ETF | peripheral_nervous_system | 9.34316 |
| NCX | ovary | 8.98987 |
| NRF-1 | liver | 8.96772 |
| MAZ | brain | 8.9516 |
| FOXO3 | heart | 8.43936 |
| SRY | peripheral_nervous_system | 8.18913 |
| HNF-1 | liver | 7.75917 |
| ZIC2 | brain | 7.62238 |
| TFIIA | brain | 7.17265 |
| FOXO4 | heart | 7.12231 |
| HAND1/E47 | brain | 7.07262 |
| CDP | muscle | 6.8821 |
| HLF | lung | 6.78962 |
| MAZR | lung | 6.78529 |
| BACH1 | tongue | 6.76838 |
| CRX | lung | 6.75604 |
| E2F | lung | 6.7402 |
| C/EBPBETA | muscle | 6.70556 |
| C-REL | pancreas | 6.48133 |
| CREB | tongue | 6.33295 |
| TCF11/MAFG | brain | 6.31207 |
| STAT1 | larynx | 6.20649 |
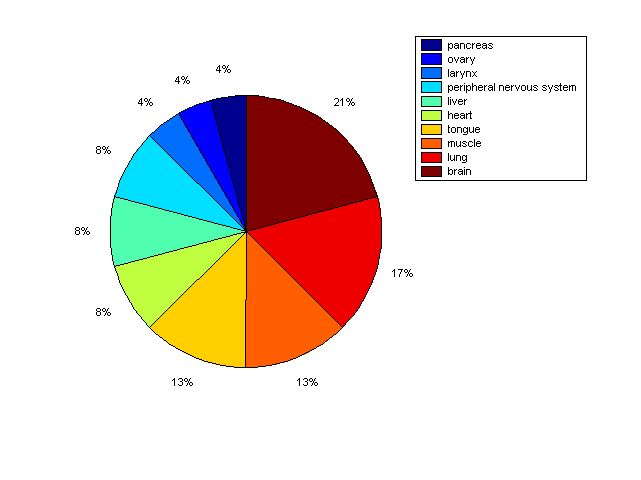
Distribution of Co-regulatory TFs
|
|
|
Description: this pie chart displays the distribution of co-regulatory transcription factors (TFs) in different tissues. Color schema: the tissue with the largest percentage of co-regulatory TFs is colored dark red whereas the tissue with the smallest percentage of co-regulatory TFs is colored dark blue. Tissues with intermediate percentages of co-regulatory TFs are colored from light red to yellow and cyan and then to light blue. |