Summary Table (Download Table)
| Co-regulatory TF | Tissue | -log(P) |
  | | |
| HNF-1 | kidney | 15.4257 |
| LHX3 | placenta | 15.2186 |
| CHX10 | placenta | 13.8371 |
| AFP1 | placenta | 9.61476 |
| ATF | placenta | 9.4489 |
| FREAC-3 | bone_marrow | 7.84751 |
| HNF-1 | liver | 7.81267 |
| FREAC-4 | soft_tissue | 7.34945 |
| NERF1A | soft_tissue | 7.30502 |
| FOXO4 | liver | 7.10659 |
| AP-4 | muscle | 7.01406 |
| CDP | eye | 6.99747 |
| HNF-1 | colon | 6.83555 |
| NF-E2 | muscle | 6.77711 |
| CDP | soft_tissue | 6.76442 |
| HNF-6 | eye | 6.74287 |
| TAL-1BETA/ITF-2 | muscle | 6.58843 |
| HNF-4 | liver | 6.55641 |
| P53 | muscle | 6.48108 |
| CREB | eye | 6.39898 |
| NKX3A | bone_marrow | 6.25579 |
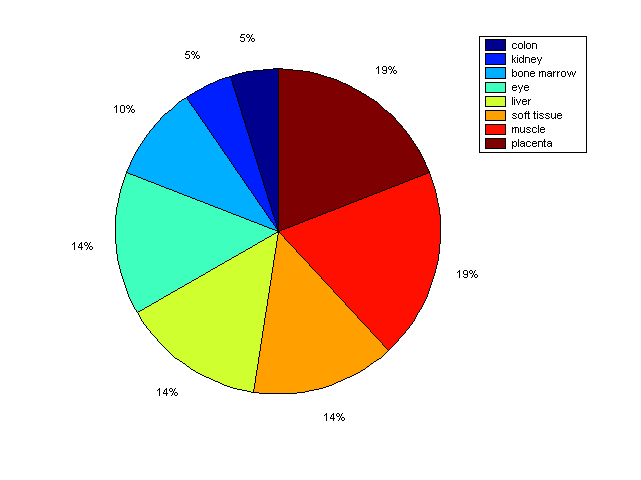
Distribution of Co-regulatory TFs
|
|
|
Description: this pie chart displays the distribution of co-regulatory transcription factors (TFs) in different tissues. Color schema: the tissue with the largest percentage of co-regulatory TFs is colored dark red whereas the tissue with the smallest percentage of co-regulatory TFs is colored dark blue. Tissues with intermediate percentages of co-regulatory TFs are colored from light red to yellow and cyan and then to light blue. |