Summary Table (Download Table)
| Co-regulatory TF | Tissue | -log(P) |
  | | |
| AHR/ARNT | lymph_node | 8.61897 |
| AHR/ARNT | muscle | 6.22861 |
| ALX-4 | soft_tissue | 8.83007 |
| AMEF-2 | muscle | 19.6476 |
| AML-1A | spleen | 8.76167 |
| AML1 | spleen | 8.76167 |
| AP-1 | heart | 7.10612 |
| AP-1 | spleen | 7.7235 |
| AP-2 | brain | 6.97994 |
| AP-2 | spleen | 9.75718 |
| AP-2ALPHA | blood | 7.70615 |
| AP-2ALPHA | brain | 11.4023 |
| AP-2ALPHA | lymph_node | 7.81354 |
| AP-2GAMMA | blood | 11.0982 |
| AP-2GAMMA | brain | 7.6358 |
| AP-2GAMMA | lymph_node | 9.51538 |
| AP-2GAMMA | spleen | 7.16314 |
| AP-4 | blood | 9.35899 |
| AP-4 | bone | 7.70418 |
| AP-4 | brain | 7.27224 |
| AP-4 | lymph_node | 6.65626 |
| AP-4 | spleen | 8.99846 |
| AR | muscle | 7.22289 |
| AREB6 | eye | 6.23491 |
| AREB6 | soft_tissue | 7.79913 |
| AREB6 | spleen | 9.03166 |
| ARNT | muscle | 13.0077 |
| ATF | kidney | 7.13383 |
| ATF | thymus | 8.35371 |
| BRN-2 | muscle | 9.19315 |
| C-ETS-1 | muscle | 9.46518 |
| C-ETS-1 | spleen | 10.038 |
| C-ETS-1 | thymus | 9.4377 |
| C-MYC/MAX | muscle | 11.911 |
| C-REL | small_intestine | 9.55886 |
| C/EBP | muscle | 13.6089 |
| C/EBPBETA | brain | 8.75482 |
| C/EBPBETA | lymph_node | 7.11356 |
| CACCC-BINDING_FACTOR | brain | 6.92028 |
| CACCC-BINDING_FACTOR | muscle | 11.4453 |
| CACCC-BINDING_FACTOR | soft_tissue | 10.4204 |
| CART-1 | larynx | 7.29061 |
| CHX10 | larynx | 6.74584 |
| COUP-TF/HNF-4 | muscle | 18.0665 |
| CRE-BP1 | blood | 8.85579 |
| CREB | blood | 6.54827 |
| CREB | thymus | 6.51109 |
| CRX | muscle | 6.51264 |
| DBP | soft_tissue | 7.91564 |
| E12 | muscle | 8.41522 |
| E2F-1 | tongue | 9.22913 |
| E47 | lymph_node | 7.78611 |
| EGR-1 | lymph_node | 6.59979 |
| EGR-2 | spleen | 6.83682 |
| ELK-1 | bone_marrow | 6.16337 |
| ELK-1 | muscle | 7.64049 |
| ER | muscle | 8.00727 |
| ETF | brain | 22.8732 |
| ETF | lung | 9.96811 |
| ETF | ovary | 6.18127 |
| FOXO1 | soft_tissue | 8.44173 |
| FOXO3 | small_intestine | 6.27118 |
| FOXO3 | spleen | 6.59913 |
| FOXO4 | small_intestine | 7.70757 |
| FREAC-3 | mammary_gland | 9.08826 |
| FREAC-4 | soft_tissue | 7.86863 |
| GATA-1 | spleen | 8.20796 |
| GATA-2 | spleen | 6.44025 |
| GATA-3 | spleen | 7.4698 |
| GATA-4 | spleen | 6.87526 |
| GATA-6 | larynx | 6.59019 |
| GATA-X | small_intestine | 6.36015 |
| HEB | blood | 8.96519 |
| HEB | bone | 11.6555 |
| HEB | brain | 13.6006 |
| HEB | lymph_node | 7.41339 |
| HEB | spleen | 7.63142 |
| HFH-3 | mammary_gland | 7.39628 |
| HIF-1 | bone | 10.5969 |
| HNF-1 | kidney | 7.48434 |
| HNF-1 | small_intestine | 10.042 |
| HNF-1 | spleen | 6.6063 |
| HNF-3ALPHA | mammary_gland | 8.48201 |
| HNF-4 | muscle | 9.73019 |
| HOXA4 | larynx | 6.17775 |
| LBP-1 | brain | 6.1666 |
| LBP-1 | muscle | 9.37627 |
| LBP-1 | spleen | 6.64069 |
| LMO2_COMPLEX | bone | 9.03803 |
| LMO2_COMPLEX | muscle | 6.61611 |
| LUN-1 | larynx | 6.41671 |
| LUN-1 | soft_tissue | 16.8673 |
| LXR | small_intestine | 6.60596 |
| MAX | muscle | 12.0082 |
| MAZ | brain | 8.23177 |
| MAZR | muscle | 8.70485 |
| MEF-2 | heart | 17.1381 |
| MEF-2 | larynx | 11.9361 |
| MEF-2 | muscle | 23.5159 |
| MIF-1 | brain | 6.32287 |
| MIF-1 | muscle | 7.69319 |
| MIF-1 | small_intestine | 6.20459 |
| MRF-2 | muscle | 11.5974 |
| MYOD | spleen | 13.4118 |
| MZF1 | bone | 7.41628 |
| MZF1 | brain | 11.9972 |
| NERF1A | larynx | 8.31934 |
| NERF1A | spleen | 8.57483 |
| NF-KAPPAB | brain | 9.4366 |
| NF-KAPPAB | muscle | 8.07983 |
| NF-KAPPAB | small_intestine | 10.8836 |
| NF-KAPPAB_(P50) | brain | 6.48751 |
| NF-KAPPAB_(P65) | larynx | 6.19626 |
| NF-KAPPAB_(P65) | lymph_node | 7.15025 |
| NF-KAPPAB_(P65) | small_intestine | 10.4949 |
| NF-KAPPAB_(P65) | stomach | 6.46935 |
| NF-Y | testis | 7.22874 |
| NF-Y | thymus | 9.64029 |
| NKX2-2 | muscle | 7.92013 |
| NKX3A | muscle | 7.2512 |
| NKX3A | small_intestine | 14.6058 |
| NR2E3 | muscle | 10.5524 |
| NRF-1 | lung | 7.18677 |
| NRF-1 | small_intestine | 7.33455 |
| NRL | muscle | 10.2945 |
| P53 | muscle | 8.58482 |
| P53 | small_intestine | 6.95362 |
| PPARALPHA/RXR-ALPHA | muscle | 8.64622 |
| PPARG | muscle | 6.99733 |
| RB/E2F-1/DP-1 | brain | 6.59562 |
| RB/E2F-1/DP-1 | tongue | 6.33611 |
| RFX1 | muscle | 13.293 |
| RREB-1 | brain | 8.4002 |
| RREB-1 | eye | 6.65407 |
| RSRFC4 | heart | 14.2437 |
| RSRFC4 | larynx | 7.35117 |
| SF-1 | brain | 6.85147 |
| SMAD-4 | brain | 10.1738 |
| SP1 | lymph_node | 7.28921 |
| SP3 | lymph_node | 6.9416 |
| SP3 | muscle | 9.73634 |
| SREBP-1 | blood | 8.24408 |
| SREBP-1 | lymph_node | 6.95177 |
| SREBP-1 | muscle | 15.8274 |
| SRF | heart | 6.4409 |
| STAT1 | bladder | 8.03759 |
| STAT3 | bladder | 6.75409 |
| STAT3 | bone_marrow | 9.60883 |
| STAT5A | soft_tissue | 7.80503 |
| STAT5A_(HOMODIMER) | bladder | 7.19845 |
| STAT5B_(HOMODIMER) | bladder | 7.32285 |
| STAT5B_(HOMODIMER) | muscle | 6.47497 |
| TATA | larynx | 7.43226 |
| TATA | muscle | 11.0243 |
| TAX/CREB | brain | 8.03819 |
| TAX/CREB | spleen | 10.2377 |
| TAX/CREB | thymus | 10.3192 |
| TBP | mammary_gland | 7.71016 |
| TFIIA | muscle | 7.8705 |
| TST-1 | muscle | 6.806 |
| USF | muscle | 13.6412 |
| USF2 | muscle | 14.3127 |
| VDR | skin | 8.03881 |
| ZIC2 | blood | 6.2606 |
| ZIC2 | lymph_node | 6.90047 |
| ZIC2 | spleen | 15.5408 |
| ZID | brain | 10.0274 |
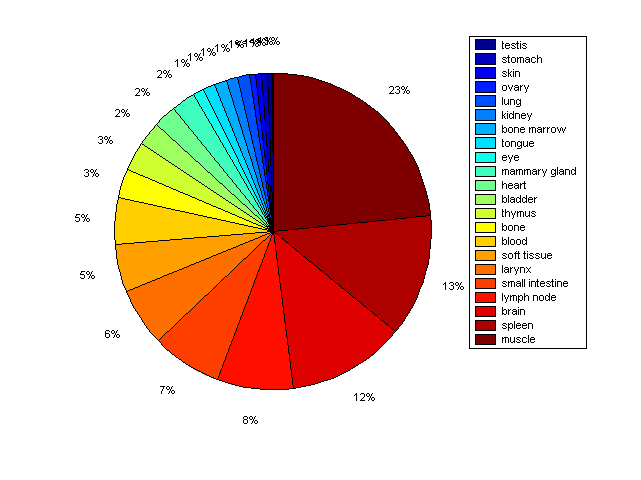
Distribution of Co-regulatory TFs
|
|
|
Description: this pie chart displays the distribution of co-regulatory transcription factors (TFs) in different tissues. Color schema: the tissue with the largest percentage of co-regulatory TFs is colored dark red whereas the tissue with the smallest percentage of co-regulatory TFs is colored dark blue. Tissues with intermediate percentages of co-regulatory TFs are colored from light red to yellow and cyan and then to light blue. |