Summary Table (Download Table)
| Co-regulatory TF | Tissue | -log(P) |
  | | |
| SREBP-1 | bladder | 48.8434 |
| ARNT | bladder | 25.2508 |
| C-MYC/MAX | bladder | 24.5315 |
| USF | bladder | 23.6468 |
| USF2 | bladder | 22.6349 |
| USF | muscle | 16.7942 |
| SREBP-1 | muscle | 14.7167 |
| SREBP-1 | bone_marrow | 14.707 |
| PAX-8 | bladder | 13.0884 |
| MAX | bladder | 12.8657 |
| LBP-1 | muscle | 12.0082 |
| XBP-1 | bladder | 11.839 |
| RFX1 | muscle | 11.7143 |
| USF | bone_marrow | 9.91953 |
| MEIS1 | larynx | 9.75532 |
| MIF-1 | muscle | 9.44636 |
| PAX-2 | bladder | 9.41265 |
| C-MYC/MAX | bone_marrow | 9.34074 |
| ARNT | muscle | 9.21425 |
| MEF-2 | muscle | 9.124 |
| RSRFC4 | muscle | 8.82931 |
| C-MYC/MAX | muscle | 8.73067 |
| TCF-4 | small_intestine | 8.66576 |
| NRF-1 | bone_marrow | 8.58508 |
| CHX10 | eye | 8.4931 |
| USF2 | bone_marrow | 8.42732 |
| GCM | larynx | 8.36403 |
| LHX3 | small_intestine | 8.22972 |
| GABP | small_intestine | 8.19891 |
| AP-4 | muscle | 8.19528 |
| E4BP4 | muscle | 8.18342 |
| IPF1 | muscle | 8.04762 |
| ARP-1 | eye | 8.03875 |
| USF2 | muscle | 7.89925 |
| ALX-4 | muscle | 7.72133 |
| ATF4 | bladder | 7.69388 |
| C-MYC/MAX | bone | 7.46534 |
| GATA-4 | larynx | 7.38506 |
| MYOD | muscle | 7.30594 |
| MEIS1 | muscle | 7.09704 |
| ARNT | bone_marrow | 7.00627 |
| C/EBPDELTA | larynx | 6.98815 |
| GATA-1 | muscle | 6.75544 |
| POU1F1 | muscle | 6.74543 |
| SOX-9 | muscle | 6.55256 |
| SP3 | larynx | 6.54205 |
| SREBP-1 | small_intestine | 6.51145 |
| RREB-1 | larynx | 6.48812 |
| ALPHA-CP1 | larynx | 6.27355 |
| C/EBPBETA | muscle | 6.23417 |
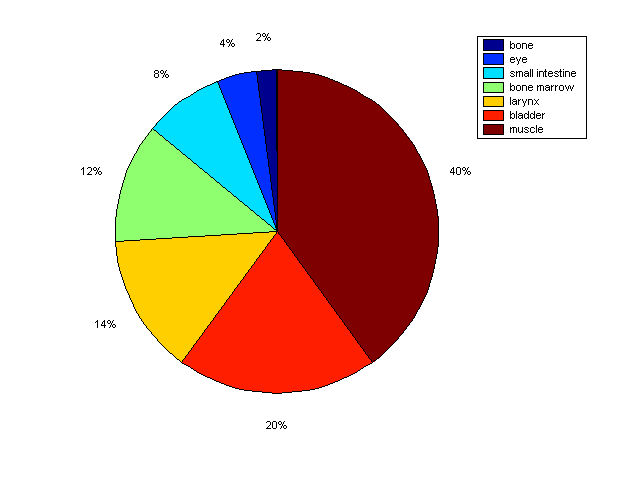
Distribution of Co-regulatory TFs
|
|
|
Description: this pie chart displays the distribution of co-regulatory transcription factors (TFs) in different tissues. Color schema: the tissue with the largest percentage of co-regulatory TFs is colored dark red whereas the tissue with the smallest percentage of co-regulatory TFs is colored dark blue. Tissues with intermediate percentages of co-regulatory TFs are colored from light red to yellow and cyan and then to light blue. |