Summary Table (Download Table)
| Co-regulatory TF | Tissue | -log(P) |
  | | |
| PEA3 | lymph_node | 11.329 |
| TEF | muscle | 8.83566 |
| LBP-1 | spleen | 8.76167 |
| PAX-1 | brain | 8.66782 |
| STAT4 | muscle | 8.29892 |
| FOXD3 | muscle | 7.82128 |
| OCT-1 | colon | 7.69362 |
| EF-C | bone | 7.67362 |
| MEF-2 | muscle | 7.5799 |
| AML-1A | pancreas | 7.26419 |
| NKX3A | colon | 7.26311 |
| STAT4 | colon | 7.04058 |
| TFII-I | larynx | 7.00533 |
| OSF2 | blood | 6.76697 |
| TITF1 | blood | 6.58624 |
| AP-1 | blood | 6.54398 |
| HNF-6 | colon | 6.43552 |
| ELF-1 | colon | 6.37349 |
| FREAC-2 | muscle | 6.3706 |
| MEIS1B/HOXA9 | blood | 6.36285 |
| RFX1 | bone | 6.35732 |
| ELK-1 | bone_marrow | 6.35391 |
| C-ETS-2 | thymus | 6.24019 |
| FOXO1 | colon | 6.22372 |
| MEF-2 | blood | 6.20931 |
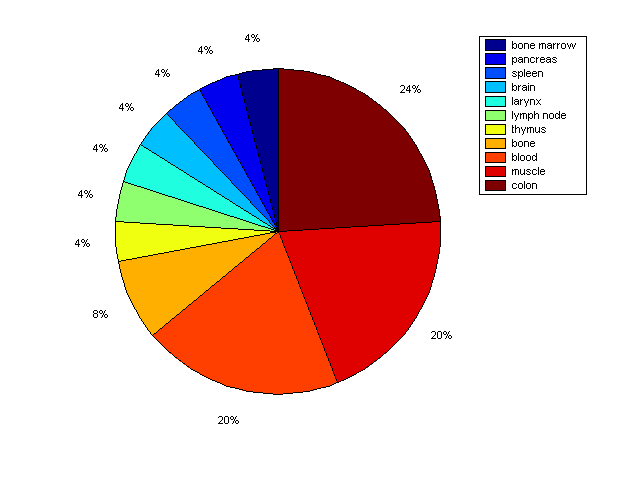
Distribution of Co-regulatory TFs
|
|
|
Description: this pie chart displays the distribution of co-regulatory transcription factors (TFs) in different tissues. Color schema: the tissue with the largest percentage of co-regulatory TFs is colored dark red whereas the tissue with the smallest percentage of co-regulatory TFs is colored dark blue. Tissues with intermediate percentages of co-regulatory TFs are colored from light red to yellow and cyan and then to light blue. |