Summary Table (Download Table)
| Co-regulatory TF | Tissue | -log(P) |
  | | |
| USF2 | tongue | 6.3182 |
| STAT1 | tongue | 6.27735 |
| SREBP-1 | tongue | 6.8594 |
| SP3 | tongue | 9.89362 |
| SP1 | tongue | 10.3601 |
| PAX-2 | tongue | 8.41089 |
| OCT-1 | tongue | 6.24954 |
| NRF-1 | tongue | 9.72467 |
| NF-Y | tongue | 6.27284 |
| NF-AT | tongue | 6.86875 |
| MZF1 | tongue | 9.22184 |
| MAZR | tongue | 12.0398 |
| HIF-1 | tongue | 8.78114 |
| GATA-3 | tongue | 8.6505 |
| CREB | tongue | 8.02428 |
| CRE-BP1/C-JUN | tongue | 6.88526 |
| CRE-BP1 | tongue | 6.34458 |
| C/EBP | tongue | 9.44361 |
| BSAP | tongue | 6.23382 |
| ATF | tongue | 8.65754 |
| TAX/CREB | thymus | 10.6281 |
| STAT5A_(HOMOTETRAMER) | thymus | 6.98045 |
| RB/E2F-1/DP-1 | thymus | 6.25593 |
| NF-KAPPAB | thymus | 8.3388 |
| IRF1 | thymus | 6.2741 |
| GR | thymus | 6.17765 |
| E2F-1 | thymus | 6.50358 |
| SP1 | testis | 8.83013 |
| NRF-1 | testis | 11.7845 |
| NF-Y | testis | 7.12092 |
| GABP | testis | 6.74807 |
| ETF | testis | 6.17184 |
| ELK-1 | testis | 8.76633 |
| E2F-1 | testis | 6.57047 |
| ATF | testis | 7.43061 |
| STAT5A_(HOMOTETRAMER) | soft_tissue | 9.43165 |
| RB/E2F-1/DP-1 | soft_tissue | 8.78257 |
| NF-KAPPAB_(P65) | soft_tissue | 6.54202 |
| NF-KAPPAB_(P50) | soft_tissue | 6.34047 |
| NF-KAPPAB | soft_tissue | 7.60532 |
| GR | soft_tissue | 7.93577 |
| E2F-1 | soft_tissue | 7.16824 |
| DBP | soft_tissue | 6.87831 |
| CDP_CR3+HD | soft_tissue | 6.40008 |
| C-REL | soft_tissue | 8.76071 |
| ZID | small_intestine | 6.71442 |
| WHN | small_intestine | 8.59886 |
| VDR | small_intestine | 7.89615 |
| TST-1 | small_intestine | 7.58315 |
| TATA | small_intestine | 6.77628 |
| TAL-1ALPHA/E47 | small_intestine | 7.84027 |
| SRF | small_intestine | 18.79 |
| SP1 | small_intestine | 8.73083 |
| RREB-1 | small_intestine | 7.63295 |
| RFX1 | small_intestine | 6.39536 |
| PPARG | small_intestine | 6.40023 |
| POU3F2 | small_intestine | 8.87476 |
| PEA3 | small_intestine | 8.40758 |
| PAX-3 | small_intestine | 6.96861 |
| OCT-1 | small_intestine | 10.7382 |
| NRF-1 | small_intestine | 8.73561 |
| NF-Y | small_intestine | 9.52444 |
| NERF1A | small_intestine | 9.43662 |
| IRF-7 | small_intestine | 8.03113 |
| HMG_IY | small_intestine | 8.16905 |
| HEB | small_intestine | 7.07722 |
| ETF | small_intestine | 6.62234 |
| ELK-1 | small_intestine | 9.79841 |
| E47 | small_intestine | 7.17335 |
| C-REL | small_intestine | 10.094 |
| C-MYB | small_intestine | 6.22389 |
| BACH2 | small_intestine | 6.19168 |
| AP-2ALPHA | small_intestine | 7.71325 |
| AP-2 | small_intestine | 6.98099 |
| ALPHA-CP1 | small_intestine | 6.34305 |
| AHR/ARNT | small_intestine | 6.76968 |
| NKX6-2 | skin | 8.93057 |
| LHX3 | placenta | 10.1275 |
| ETF | placenta | 6.94098 |
| E4F1 | peripheral_nervous_system | 6.48544 |
| ATF | peripheral_nervous_system | 6.24974 |
| VDR | ovary | 7.42501 |
| OCT-1 | ovary | 6.29904 |
| AHR/ARNT | ovary | 7.70089 |
| RREB-1 | muscle | 8.55341 |
| TST-1 | mammary_gland | 8.39612 |
| SRY | mammary_gland | 12.1579 |
| PBX-1 | mammary_gland | 6.43361 |
| NRF-1 | lymph_node | 6.28331 |
| NF-Y | lymph_node | 6.9638 |
| SRY | lung | 7.12503 |
| NRF-1 | lung | 7.40541 |
| NF-KAPPAB_(P50) | lung | 6.5732 |
| MEF-2 | lung | 6.50225 |
| CDP_CR1 | lung | 6.7402 |
| AP-2GAMMA | lung | 6.32672 |
| NRF-1 | liver | 10.4303 |
| YY1 | larynx | 7.79913 |
| WHN | larynx | 8.61695 |
| TFII-I | larynx | 7.43691 |
| SRF | larynx | 7.46849 |
| RB/E2F-1/DP-1 | larynx | 10.4386 |
| NRF-1 | larynx | 6.62048 |
| NF-Y | larynx | 7.64205 |
| MAZR | larynx | 10.1355 |
| E2F-4/DP-2 | larynx | 8.43504 |
| E2F-4/DP-1 | larynx | 8.85839 |
| E2F-1/DP-2 | larynx | 7.47891 |
| E2F-1/DP-1 | larynx | 6.6575 |
| E2F-1 | larynx | 10.2694 |
| E2F | larynx | 9.6834 |
| CHX10 | larynx | 7.12882 |
| C-MYC/MAX | larynx | 6.33667 |
| AR | larynx | 7.45978 |
| TAL-1BETA/E47 | heart | 7.00068 |
| SRF | heart | 9.15755 |
| LXR | heart | 7.58039 |
| ICSBP | heart | 8.13784 |
| FOXD3 | heart | 6.44101 |
| CDP | heart | 6.46737 |
| RB/E2F-1/DP-1 | cervix | 9.16392 |
| PPARG | cervix | 8.10307 |
| NRF-1 | cervix | 7.42151 |
| ELK-1 | cervix | 8.14688 |
| E2F-4/DP-1 | cervix | 7.80984 |
| E2F-1 | cervix | 8.58064 |
| E2F | cervix | 8.44077 |
| CREB | cervix | 6.46009 |
| CACCC-BINDING_FACTOR | cervix | 7.22264 |
| C-MYC/MAX | cervix | 8.93122 |
| AP-2 | cervix | 6.31968 |
| AHR/ARNT | cervix | 9.88729 |
| TEF | brain | 9.17533 |
| SMAD-4 | brain | 8.76484 |
| PAX-8 | brain | 6.36678 |
| P53 | brain | 7.05188 |
| MZF1 | brain | 7.98216 |
| MTF-1 | brain | 8.3386 |
| GCM | brain | 8.11225 |
| ETF | brain | 10.0124 |
| C/EBP | brain | 6.34894 |
| AP-2REP | brain | 8.80768 |
| STAT1 | bone_marrow | 10.0928 |
| RB/E2F-1/DP-1 | bone_marrow | 7.71267 |
| NRF-1 | bone_marrow | 13.4771 |
| ETF | bone_marrow | 7.16214 |
| E2F-4/DP-2 | bone_marrow | 8.62032 |
| E2F-4/DP-1 | bone_marrow | 7.82594 |
| E2F-1/DP-2 | bone_marrow | 9.47278 |
| E2F-1/DP-1 | bone_marrow | 7.41167 |
| E2F-1 | bone_marrow | 7.36917 |
| E2F | bone_marrow | 6.45693 |
| NF-E2 | bone | 7.27355 |
| LF-A1 | bone | 6.35387 |
| GR | bone | 6.19512 |
| ATF | bone | 11.6301 |
| NRF-1 | blood | 12.2319 |
| ETF | blood | 9.00351 |
| NRF-1 | bladder | 17.283 |
| ETF | bladder | 9.748 |
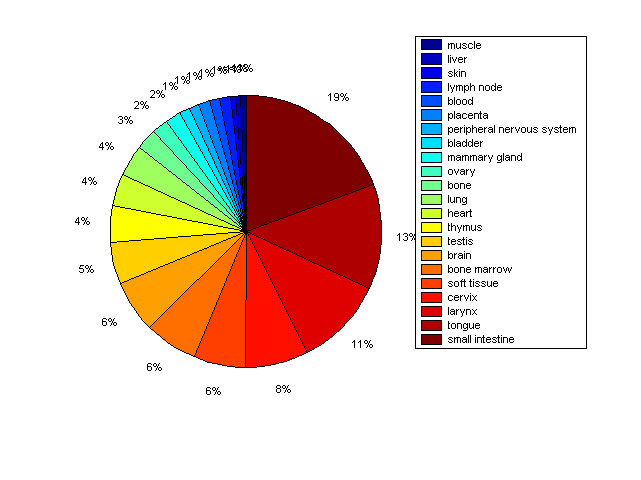
Distribution of Co-regulatory TFs
|
|
|
Description: this pie chart displays the distribution of co-regulatory transcription factors (TFs) in different tissues. Color schema: the tissue with the largest percentage of co-regulatory TFs is colored dark red whereas the tissue with the smallest percentage of co-regulatory TFs is colored dark blue. Tissues with intermediate percentages of co-regulatory TFs are colored from light red to yellow and cyan and then to light blue. |