Summary Table (Download Table)
| Co-regulatory TF | Tissue | -log(P) |
  | | |
| ETF | larynx | 14.9056 |
| ATF | bone | 14.6156 |
| E2F | bone_marrow | 9.47278 |
| NRF-1 | bladder | 9.40165 |
| E2F-4/DP-1 | bone_marrow | 9.12265 |
| MAZ | small_intestine | 8.86717 |
| E2F-4/DP-2 | bone_marrow | 8.75844 |
| NF-KAPPAB_(P50) | tongue | 8.65756 |
| SP3 | small_intestine | 8.60989 |
| NRF-1 | bone_marrow | 8.2751 |
| E2F-1/DP-1 | bone_marrow | 8.16991 |
| TITF1 | small_intestine | 8.05567 |
| NRF-1 | lymph_node | 7.9158 |
| NF-KAPPAB | tongue | 7.70435 |
| ATF-1 | bone | 7.65412 |
| E2F | larynx | 7.47891 |
| E2F-1 | bone_marrow | 7.44537 |
| NF-Y | lymph_node | 7.39338 |
| LMO2_COMPLEX | tongue | 7.32726 |
| CREB | bone | 7.19917 |
| ATF4 | stomach | 7.06324 |
| CRX | eye | 6.84831 |
| NRF-1 | blood | 6.74656 |
| MAZR | larynx | 6.55032 |
| NF-Y | bladder | 6.53062 |
| RB/E2F-1/DP-1 | bone_marrow | 6.36263 |
| YY1 | tongue | 6.33691 |
| CHOP-C/EBPALPHA | tongue | 6.16418 |
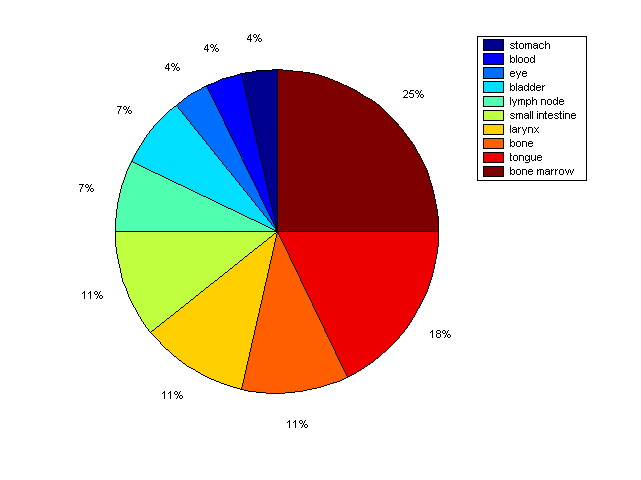
Distribution of Co-regulatory TFs
|
|
|
Description: this pie chart displays the distribution of co-regulatory transcription factors (TFs) in different tissues. Color schema: the tissue with the largest percentage of co-regulatory TFs is colored dark red whereas the tissue with the smallest percentage of co-regulatory TFs is colored dark blue. Tissues with intermediate percentages of co-regulatory TFs are colored from light red to yellow and cyan and then to light blue. |