Summary Table (Download Table)
| Co-regulatory TF | Tissue | -log(P) |
  | | |
| XBP-1 | placenta | 8.06478 |
| USF2 | brain | 6.34212 |
| USF | brain | 9.15032 |
| TFIIA | larynx | 7.28991 |
| TCF11/MAFG | brain | 9.9423 |
| TCF11 | soft_tissue | 6.37649 |
| TBP | blood | 6.3309 |
| TATA | placenta | 8.58741 |
| STAT5A | eye | 16.9589 |
| STAT1 | eye | 7.37342 |
| STAT1 | bone_marrow | 6.1924 |
| SRY | brain | 9.22861 |
| SRF | larynx | 7.12042 |
| SRF | eye | 9.21553 |
| SMAD-3 | eye | 12.783 |
| SMAD-3 | brain | 12.9287 |
| SF-1 | eye | 11.1258 |
| RSRFC4 | brain | 10.1342 |
| RORALPHA1 | placenta | 13.8371 |
| RFX1 | eye | 6.42619 |
| RFX1 | brain | 10.267 |
| PU.1 | colon | 7.07061 |
| POU3F2 | blood | 10.1873 |
| PBX1B | placenta | 7.35496 |
| PAX-3 | placenta | 8.98192 |
| OCT-X | eye | 8.36703 |
| OCT-1 | eye | 13.0596 |
| OCT-1 | brain | 9.00275 |
| NRSF | small_intestine | 8.40024 |
| NKX6-2 | placenta | 7.33722 |
| NKX6-2 | brain | 9.91913 |
| NKX3A | kidney | 7.91894 |
| NKX2-2 | eye | 9.11187 |
| NF-Y | brain | 7.99896 |
| NF-KAPPAB_(P65) | placenta | 6.60489 |
| NF-E2 | brain | 8.7449 |
| NF-1 | kidney | 6.7258 |
| NF-1 | brain | 7.89094 |
| MZF1 | brain | 8.57172 |
| MYOD | peripheral_nervous_system | 6.89346 |
| MEF-2 | muscle | 13.0607 |
| MEF-2 | larynx | 9.0866 |
| MEF-2 | brain | 7.05256 |
| MEF-2 | blood | 9.97035 |
| MAX | eye | 8.4931 |
| LUN-1 | soft_tissue | 8.6268 |
| LUN-1 | brain | 14.1627 |
| LHX3 | placenta | 31.238 |
| LHX3 | eye | 11.452 |
| LHX3 | brain | 7.00544 |
| LBP-1 | larynx | 6.74584 |
| ISRE | small_intestine | 10.0578 |
| IRF-1 | larynx | 6.30757 |
| ICSBP | small_intestine | 6.66633 |
| HSF2 | brain | 9.7598 |
| HOXA4 | small_intestine | 7.11336 |
| HOXA4 | muscle | 6.44121 |
| HOXA4 | heart | 6.32075 |
| HNF-6 | eye | 16.2563 |
| HNF-4 | brain | 9.01329 |
| HNF-1 | small_intestine | 8.09357 |
| HNF-1 | kidney | 8.62597 |
| HLF | bone_marrow | 6.56475 |
| GCNF | kidney | 12.1292 |
| GCNF | eye | 9.27377 |
| GATA-X | kidney | 6.54944 |
| GATA-6 | eye | 18.7433 |
| GATA-4 | small_intestine | 9.43993 |
| GATA-4 | muscle | 6.8453 |
| GATA-1 | soft_tissue | 6.47967 |
| FXR | eye | 11.6646 |
| FREAC-2 | brain | 7.56039 |
| FOXO4 | eye | 12.1187 |
| FOXO3 | kidney | 9.00139 |
| FOXO3 | eye | 10.6021 |
| FOXO3 | brain | 10.9912 |
| FOXJ2 | brain | 7.61744 |
| FOXD3 | brain | 8.74064 |
| ERR_ALPHA | placenta | 6.5769 |
| ER | larynx | 6.17661 |
| EF-C | brain | 8.4104 |
| E4BP4 | bone_marrow | 6.95627 |
| E47 | eye | 6.41445 |
| E2F | larynx | 7.12882 |
| CRX | eye | 28.4156 |
| CREB | placenta | 13.7539 |
| CREB | bone | 7.81123 |
| CRE-BP1/C-JUN | placenta | 8.70123 |
| CRE-BP1/C-JUN | eye | 7.5876 |
| CRE-BP1 | placenta | 11.5634 |
| COUP-TF/HNF-4 | small_intestine | 6.77816 |
| CHX10 | placenta | 8.11088 |
| CHX10 | eye | 32.5137 |
| CHX10 | brain | 6.41789 |
| CDP_CR3 | larynx | 6.22687 |
| CDP_CR3 | eye | 6.51605 |
| CDP | placenta | 6.7773 |
| CDP | eye | 18.0681 |
| C/EBPGAMMA | kidney | 6.50408 |
| C/EBPDELTA | eye | 7.35819 |
| C/EBPALPHA | brain | 7.07586 |
| C/EBP | muscle | 7.89835 |
| ATF6 | eye | 6.89204 |
| ATF4 | placenta | 7.25302 |
| ATF3 | placenta | 6.73314 |
| ATF-1 | placenta | 21.47 |
| ATF-1 | brain | 6.8576 |
| ATF | placenta | 23.6846 |
| ARNT | brain | 6.77706 |
| AP-3 | eye | 15.0943 |
| ALPHA-CP1 | small_intestine | 6.24695 |
| ALPHA-CP1 | brain | 12.0298 |
| AHR/ARNT | colon | 6.20254 |
| AFP1 | placenta | 16.3396 |
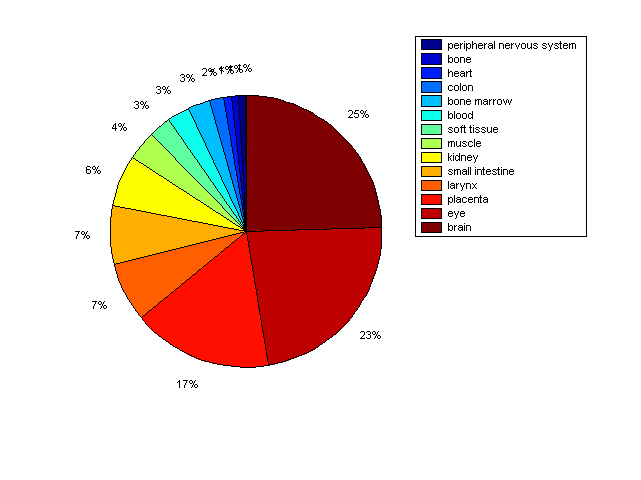
Distribution of Co-regulatory TFs
|
|
|
Description: this pie chart displays the distribution of co-regulatory transcription factors (TFs) in different tissues. Color schema: the tissue with the largest percentage of co-regulatory TFs is colored dark red whereas the tissue with the smallest percentage of co-regulatory TFs is colored dark blue. Tissues with intermediate percentages of co-regulatory TFs are colored from light red to yellow and cyan and then to light blue. |