Summary Table (Download Table)
| Co-regulatory TF | Tissue | -log(P) |
  | | |
| ATF | tongue | 17.4631 |
| CREB | tongue | 16.1105 |
| CRE-BP1 | tongue | 13.7512 |
| LHX3 | placenta | 13.5725 |
| ATF-1 | tongue | 13.3117 |
| ATF | bone | 11.2463 |
| NRF-1 | tongue | 10.5525 |
| MAZ | brain | 9.16606 |
| ATF-1 | bone | 8.88046 |
| HAND1/E47 | peripheral_nervous_system | 8.67913 |
| ETF | brain | 8.39627 |
| CRE-BP1/C-JUN | testis | 8.33042 |
| C/EBPBETA | peripheral_nervous_system | 7.90894 |
| CREB | testis | 7.88328 |
| HNF-1 | colon | 7.86269 |
| HEB | pancreas | 7.78859 |
| CDP_CR3 | tongue | 7.67604 |
| E2F-1 | tongue | 7.64945 |
| E4F1 | tongue | 7.63587 |
| HNF-1 | kidney | 7.55244 |
| NF-Y | peripheral_nervous_system | 7.52606 |
| CRE-BP1/C-JUN | tongue | 7.47106 |
| NRSF | pancreas | 7.40663 |
| NRF-1 | cervix | 7.3316 |
| MAZR | brain | 7.22865 |
| PAX-3 | tongue | 7.18753 |
| BACH2 | small_intestine | 7.15621 |
| PAX-1 | peripheral_nervous_system | 7.10304 |
| NF-Y | pancreas | 7.09247 |
| WHN | tongue | 6.95836 |
| MAZ | thymus | 6.93607 |
| NF-Y | tongue | 6.93286 |
| RFX1 | pancreas | 6.88018 |
| YY1 | brain | 6.80798 |
| RFX1 | testis | 6.79228 |
| AR | peripheral_nervous_system | 6.78962 |
| CHX10 | placenta | 6.73314 |
| CREB | bone | 6.72755 |
| NF-Y | eye | 6.70115 |
| AP-2ALPHA | testis | 6.68245 |
| NF-MUE1 | pancreas | 6.59764 |
| AP-2REP | peripheral_nervous_system | 6.43185 |
| AHR/ARNT | brain | 6.35042 |
| ATF3 | tongue | 6.28233 |
| NF-MUE1 | tongue | 6.16885 |
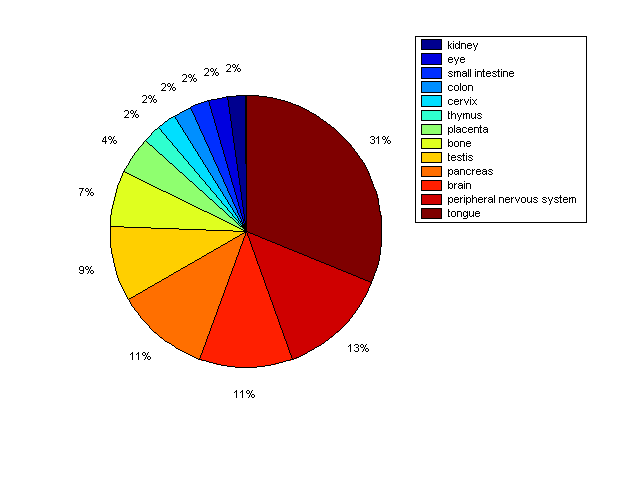
Distribution of Co-regulatory TFs
|
|
|
Description: this pie chart displays the distribution of co-regulatory transcription factors (TFs) in different tissues. Color schema: the tissue with the largest percentage of co-regulatory TFs is colored dark red whereas the tissue with the smallest percentage of co-regulatory TFs is colored dark blue. Tissues with intermediate percentages of co-regulatory TFs are colored from light red to yellow and cyan and then to light blue. |