Summary Table (Download Table)
| Co-regulatory TF | Tissue | -log(P) |
  | | |
| ISRE | lymph_node | 12.5076 |
| RSRFC4 | muscle | 10.9187 |
| GR | liver | 10.8133 |
| FREAC-3 | liver | 10.0264 |
| RSRFC4 | heart | 9.92214 |
| MEF-2 | heart | 9.8121 |
| ALX-4 | heart | 9.59825 |
| MEF-2 | kidney | 9.36015 |
| NF-AT | soft_tissue | 8.81946 |
| SRY | peripheral_nervous_system | 8.67248 |
| USF | larynx | 8.343 |
| HNF-1 | liver | 8.32907 |
| MYOD | peripheral_nervous_system | 8.25864 |
| ELF-1 | blood | 8.21882 |
| AR | liver | 8.1549 |
| FOXO3 | liver | 7.95255 |
| GCM | brain | 7.79582 |
| ELF-1 | soft_tissue | 7.76779 |
| FXR | liver | 7.65913 |
| TAL-1BETA/E47 | muscle | 7.5715 |
| AP-1 | heart | 7.52587 |
| C-MYC/MAX | larynx | 7.49784 |
| OCT-1 | heart | 7.49346 |
| TCF-4 | small_intestine | 7.46821 |
| STAT1 | thymus | 7.4155 |
| DBP | eye | 7.40661 |
| TAL-1BETA/ITF-2 | muscle | 7.36213 |
| CHX10 | eye | 7.35819 |
| RFX1 | heart | 7.30916 |
| FAC1 | lymph_node | 7.27989 |
| HNF-4 | colon | 7.27769 |
| AP-4 | kidney | 7.26412 |
| MAX | larynx | 6.98815 |
| EF-C | liver | 6.95342 |
| NF-Y | small_intestine | 6.93503 |
| MRF-2 | brain | 6.93113 |
| C-MYC/MAX | heart | 6.88318 |
| ICSBP | lymph_node | 6.81304 |
| OSF2 | soft_tissue | 6.80665 |
| LHX3 | small_intestine | 6.80447 |
| MEF-2 | small_intestine | 6.51575 |
| LHX3 | placenta | 6.51545 |
| TAL-1ALPHA/E47 | tongue | 6.32397 |
| USF | muscle | 6.29575 |
| USF | thymus | 6.23104 |
| CDC5 | prostate | 6.18354 |
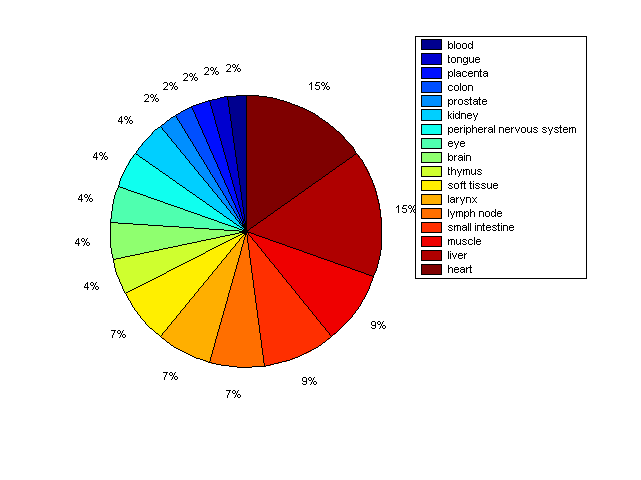
Distribution of Co-regulatory TFs
|
|
|
Description: this pie chart displays the distribution of co-regulatory transcription factors (TFs) in different tissues. Color schema: the tissue with the largest percentage of co-regulatory TFs is colored dark red whereas the tissue with the smallest percentage of co-regulatory TFs is colored dark blue. Tissues with intermediate percentages of co-regulatory TFs are colored from light red to yellow and cyan and then to light blue. |