Summary Table (Download Table)
| Co-regulatory TF | Tissue | -log(P) |
  | | |
| YY1 | tongue | 13.1439 |
| VDR | tongue | 9.04619 |
| SP1 | tongue | 23.4409 |
| RREB-1 | tongue | 7.55385 |
| PAX-8 | tongue | 7.81467 |
| NF-Y | tongue | 7.96484 |
| NF-MUE1 | tongue | 12.3097 |
| MTF-1 | tongue | 8.58917 |
| MEIS1 | tongue | 7.40945 |
| HIF-1 | tongue | 11.8726 |
| ETF | tongue | 49.0079 |
| CREB | tongue | 9.55822 |
| CDP_CR3+HD | tongue | 7.12196 |
| BSAP | tongue | 14.9358 |
| AHR/ARNT | tongue | 11.1516 |
| SP1 | thymus | 6.70779 |
| SMAD-3 | thymus | 8.43971 |
| NRF-1 | thymus | 17.4578 |
| NF-Y | thymus | 9.5346 |
| MIF-1 | thymus | 6.42632 |
| ETF | thymus | 8.38224 |
| EGR-3 | thymus | 7.79485 |
| EGR-2 | thymus | 7.99459 |
| EGR-1 | thymus | 9.27951 |
| SP1 | testis | 10.5033 |
| NRF-1 | testis | 16.4247 |
| NF-Y | testis | 8.92446 |
| MAZR | testis | 6.47037 |
| HIF-1 | testis | 6.80997 |
| ETF | testis | 11.4849 |
| EGR-3 | testis | 8.29342 |
| EGR-2 | testis | 7.83139 |
| EGR-1 | testis | 7.895 |
| E2F-4/DP-1 | testis | 7.25557 |
| E2F | testis | 6.17184 |
| C-MYC/MAX | testis | 7.98979 |
| BSAP | testis | 7.28036 |
| AP-2 | testis | 10.4292 |
| SP1 | stomach | 9.39519 |
| MAZR | stomach | 6.56842 |
| EGR-1 | stomach | 6.22038 |
| AP-2GAMMA | stomach | 11.1371 |
| AP-2 | stomach | 7.22354 |
| SREBP-1 | small_intestine | 6.26151 |
| NRF-1 | small_intestine | 13.6448 |
| E2F | small_intestine | 6.62234 |
| C-MYC/MAX | small_intestine | 11.6975 |
| AREB6 | small_intestine | 12.4798 |
| PPARG | skin | 6.17707 |
| E47 | skin | 7.64025 |
| E2F | placenta | 6.94098 |
| AP-2GAMMA | placenta | 7.80566 |
| NRF-1 | peripheral_nervous_system | 6.28073 |
| FREAC-3 | peripheral_nervous_system | 10.9734 |
| FOXD3 | peripheral_nervous_system | 7.14721 |
| CDP_CR1 | peripheral_nervous_system | 9.34316 |
| C-MYC/MAX | peripheral_nervous_system | 9.01454 |
| NRF-1 | pancreas | 8.04119 |
| C-MYC/MAX | pancreas | 10.3844 |
| ATF | pancreas | 6.99887 |
| AP-2 | pancreas | 7.08157 |
| TBP | ovary | 7.01504 |
| STAT5B_(HOMODIMER) | ovary | 6.2849 |
| LBP-1 | ovary | 6.18127 |
| HNF-1 | ovary | 9.75482 |
| FXR | ovary | 6.40494 |
| FREAC-3 | ovary | 9.82971 |
| BSAP | ovary | 8.10613 |
| AP-1 | ovary | 6.72 |
| ZID | mammary_gland | 12.1985 |
| TAX/CREB | mammary_gland | 14.5174 |
| STAT3 | mammary_gland | 9.34256 |
| SP3 | mammary_gland | 6.31201 |
| P53 | mammary_gland | 7.21477 |
| NF-KAPPAB | mammary_gland | 6.87747 |
| HIF-1 | mammary_gland | 7.34575 |
| FAC1 | mammary_gland | 7.04303 |
| ETF | mammary_gland | 9.59618 |
| AP-2 | mammary_gland | 6.80112 |
| AP-1 | mammary_gland | 6.19564 |
| SP3 | lymph_node | 7.41158 |
| SP1 | lymph_node | 9.8664 |
| NRSF | lymph_node | 6.41683 |
| NRF-1 | lymph_node | 10.9741 |
| C-MYC/MAX | lymph_node | 7.11271 |
| AP-2GAMMA | lymph_node | 8.13311 |
| TBP | lung | 10.481 |
| LMO2_COMPLEX | lung | 6.56679 |
| LBP-1 | lung | 9.96811 |
| E12 | lung | 9.10849 |
| C-MYC/MAX | lung | 10.8002 |
| MAZ | liver | 6.8756 |
| YY1 | larynx | 8.66196 |
| WHN | larynx | 17.2472 |
| TAX/CREB | larynx | 9.88676 |
| SRF | larynx | 7.07465 |
| SP1 | larynx | 10.962 |
| RB/E2F-1/DP-1 | larynx | 13.6808 |
| PPARALPHA/RXR-ALPHA | larynx | 6.96004 |
| PEA3 | larynx | 10.0128 |
| PAX-1 | larynx | 6.98069 |
| P53 | larynx | 8.72563 |
| NRF-1 | larynx | 9.69294 |
| NF-Y | larynx | 13.0767 |
| NF-KAPPAB | larynx | 9.15635 |
| NERF1A | larynx | 9.49299 |
| MTF-1 | larynx | 8.47673 |
| MAZR | larynx | 6.76196 |
| MAZ | larynx | 10.1539 |
| LXR | larynx | 12.0852 |
| GABP | larynx | 6.31479 |
| ETF | larynx | 16.8697 |
| ELK-1 | larynx | 9.79955 |
| EGR-3 | larynx | 9.71294 |
| EGR-2 | larynx | 7.22574 |
| E4F1 | larynx | 10.6936 |
| E2F-4/DP-2 | larynx | 14.5722 |
| E2F-1/DP-2 | larynx | 14.9056 |
| E2F-1/DP-1 | larynx | 13.5097 |
| E2F-1 | larynx | 13.0047 |
| C-MYC/MAX | larynx | 9.61679 |
| AP-2GAMMA | larynx | 6.58903 |
| AP-2 | larynx | 14.0964 |
| AHR/ARNT | larynx | 7.06121 |
| SP1 | kidney | 6.53938 |
| EGR-3 | kidney | 7.11687 |
| HIF-1 | heart | 6.89264 |
| EGR-3 | heart | 11.2291 |
| AP-2GAMMA | eye | 7.98615 |
| NRF-1 | cervix | 11.3386 |
| EGR-1 | cervix | 6.3094 |
| E2F-1 | cervix | 7.2465 |
| AP-2 | cervix | 10.1263 |
| TGIF | brain | 9.79826 |
| TFII-I | brain | 9.914 |
| SREBP-1 | brain | 7.22055 |
| RB/E2F-1/DP-1 | brain | 7.69749 |
| NRF-1 | brain | 9.73027 |
| MTF-1 | brain | 11.4882 |
| LBP-1 | brain | 22.8732 |
| ETF | brain | 18.494 |
| ER | brain | 9.458 |
| E2F-4/DP-1 | brain | 8.57704 |
| E2F | brain | 10.0124 |
| C-MYC/MAX | brain | 10.1767 |
| ATF3 | brain | 8.39627 |
| ATF | brain | 9.13746 |
| AP-4 | brain | 13.4819 |
| AP-2GAMMA | brain | 12.7743 |
| AP-2ALPHA | brain | 19.0119 |
| AP-2 | brain | 7.79844 |
| AHR/ARNT | brain | 7.08589 |
| RB/E2F-1/DP-1 | bone_marrow | 7.15568 |
| NRF-1 | bone_marrow | 16.3515 |
| MIF-1 | bone_marrow | 7.84479 |
| E2F-4/DP-1 | bone_marrow | 7.70668 |
| E2F | bone_marrow | 7.16214 |
| TFIIA | bone | 6.21058 |
| SP1 | bone | 12.3574 |
| GABP | bone | 6.39772 |
| EGR-3 | bone | 7.92516 |
| AP-2GAMMA | bone | 8.07265 |
| AP-2ALPHA | bone | 12.8573 |
| NRF-1 | blood | 19.0807 |
| GABP | blood | 10.6488 |
| ETF | blood | 7.77471 |
| E2F-4/DP-1 | blood | 9.38263 |
| E2F-1 | blood | 9.79176 |
| E2F | blood | 9.00351 |
| AP-2GAMMA | blood | 6.41529 |
| AP-2ALPHA | blood | 7.39247 |
| AP-2 | blood | 8.06393 |
| STAT1 | bladder | 7.06665 |
| RB/E2F-1/DP-1 | bladder | 9.13452 |
| NRF-1 | bladder | 14.8557 |
| HIF-1 | bladder | 6.59879 |
| E2F-4/DP-2 | bladder | 7.46858 |
| E2F-4/DP-1 | bladder | 7.07277 |
| E2F-1/DP-1 | bladder | 9.22146 |
| E2F-1 | bladder | 7.89568 |
| E2F | bladder | 9.748 |
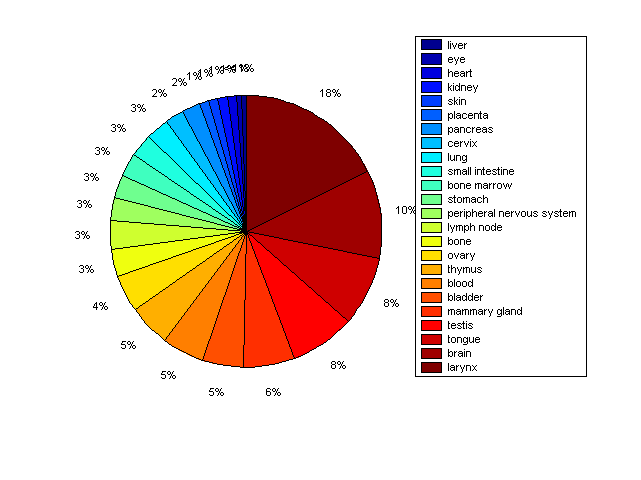
Distribution of Co-regulatory TFs
|
|
|
Description: this pie chart displays the distribution of co-regulatory transcription factors (TFs) in different tissues. Color schema: the tissue with the largest percentage of co-regulatory TFs is colored dark red whereas the tissue with the smallest percentage of co-regulatory TFs is colored dark blue. Tissues with intermediate percentages of co-regulatory TFs are colored from light red to yellow and cyan and then to light blue. |