Summary Table (Download Table)
| Co-regulatory TF | Tissue | -log(P) |
  | | |
| NF-Y | pancreas | 6.17181 |
| C-MYC/MAX | testis | 6.21275 |
| AP-2REP | peripheral_nervous_system | 6.24398 |
| PAX-2 | tongue | 6.28703 |
| AP-2ALPHA | stomach | 6.29297 |
| AP-2GAMMA | stomach | 6.32481 |
| STAT5A | muscle | 6.34734 |
| ATF-1 | pancreas | 6.38544 |
| CREB | blood | 6.38834 |
| SP1 | small_intestine | 6.43451 |
| NF-MUE1 | pancreas | 6.43495 |
| TAL-1BETA/ITF-2 | pancreas | 6.4431 |
| AR | peripheral_nervous_system | 6.51466 |
| AREB6 | stomach | 6.64947 |
| TAL-1ALPHA/E47 | pancreas | 6.65859 |
| LMO2_COMPLEX | skin | 6.79786 |
| CDP_CR3 | larynx | 6.811 |
| C-MYC/MAX | muscle | 6.82082 |
| HEB | pancreas | 6.83554 |
| BRN-2 | muscle | 6.83633 |
| MIF-1 | brain | 6.85872 |
| HFH-4 | brain | 6.86299 |
| MEIS1 | pancreas | 6.88287 |
| CHX10 | peripheral_nervous_system | 6.89346 |
| GATA-1 | muscle | 6.90176 |
| LEF-1 | pancreas | 6.92368 |
| MIF-1 | muscle | 7.00859 |
| MAZ | thymus | 7.04377 |
| MIF-1 | pancreas | 7.04815 |
| RREB-1 | thymus | 7.08574 |
| ARP-1 | brain | 7.16904 |
| E12 | peripheral_nervous_system | 7.21575 |
| MAX | muscle | 7.30594 |
| NERF1A | lymph_node | 7.34434 |
| COUP-TF/HNF-4 | pancreas | 7.38818 |
| FOXO4 | peripheral_nervous_system | 7.47531 |
| MAZR | small_intestine | 7.51867 |
| AREB6 | pancreas | 7.54566 |
| AP-2 | pancreas | 7.57452 |
| E12 | brain | 7.59896 |
| FREAC-7 | peripheral_nervous_system | 8.14475 |
| USF | muscle | 8.15026 |
| TAX/CREB | thymus | 8.18509 |
| C/EBPDELTA | peripheral_nervous_system | 8.25864 |
| GATA-6 | heart | 8.37831 |
| TST-1 | pancreas | 8.38096 |
| PITX2 | eye | 8.58718 |
| MRF-2 | peripheral_nervous_system | 8.59817 |
| ATF | pancreas | 8.76185 |
| XBP-1 | muscle | 8.77421 |
| HFH-3 | peripheral_nervous_system | 8.77822 |
| HFH-4 | peripheral_nervous_system | 8.82749 |
| PPARG | pancreas | 8.85872 |
| MYOD | pancreas | 9.13409 |
| NR2E3 | muscle | 9.13866 |
| SP1 | pancreas | 9.25244 |
| LUN-1 | soft_tissue | 9.33934 |
| C-MYC/MAX | pancreas | 9.37729 |
| STAT5A_(HOMOTETRAMER) | pancreas | 9.4 |
| FOXO1 | peripheral_nervous_system | 9.54236 |
| RFX1 | pancreas | 9.62281 |
| ELK-1 | lymph_node | 9.72407 |
| ALPHA-CP1 | muscle | 9.93598 |
| ARP-1 | pancreas | 10.0973 |
| E47 | pancreas | 10.136 |
| CRX | eye | 10.2535 |
| TATA | peripheral_nervous_system | 10.286 |
| TFII-I | brain | 10.7787 |
| AREB6 | skin | 11.3039 |
| E12 | pancreas | 11.3237 |
| SRF | heart | 11.9358 |
| ARNT | muscle | 11.9502 |
| LBP-1 | spleen | 13.4118 |
| NF-1 | muscle | 13.5659 |
| RSRFC4 | heart | 14.5174 |
| HAND1/E47 | peripheral_nervous_system | 15.2806 |
| RFX1 | muscle | 15.4553 |
| OCT-1 | peripheral_nervous_system | 16.1274 |
| MEF-2 | heart | 16.8993 |
| AMEF-2 | muscle | 29.9185 |
| RSRFC4 | muscle | 37.7658 |
| MEF-2 | muscle | 49.7415 |
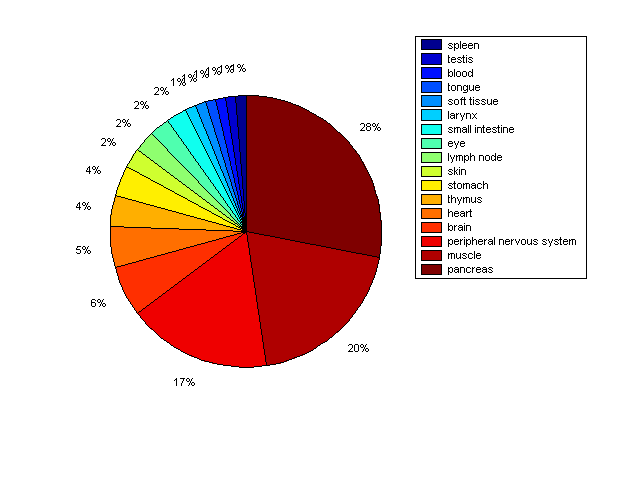
Distribution of Co-regulatory TFs
|
|
|
Description: this pie chart displays the distribution of co-regulatory transcription factors (TFs) in different tissues. Color schema: the tissue with the largest percentage of co-regulatory TFs is colored dark red whereas the tissue with the smallest percentage of co-regulatory TFs is colored dark blue. Tissues with intermediate percentages of co-regulatory TFs are colored from light red to yellow and cyan and then to light blue. |