Summary Table (Download Table)
| Co-regulatory TF | Tissue | -log(P) |
  | | |
| LEF-1 | tongue | 6.89317 |
| OCT-1 | stomach | 7.87511 |
| NKX6-2 | stomach | 7.07789 |
| CART-1 | stomach | 6.3866 |
| TGIF | soft_tissue | 6.89665 |
| TCF11 | soft_tissue | 12.3753 |
| TATA | soft_tissue | 6.99072 |
| RFX1 | soft_tissue | 6.25799 |
| FOXO4 | soft_tissue | 8.30687 |
| FOXO1 | soft_tissue | 6.78312 |
| C/EBPGAMMA | soft_tissue | 11.617 |
| C/EBPBETA | soft_tissue | 9.06506 |
| WHN | small_intestine | 12.294 |
| TITF1 | small_intestine | 7.36774 |
| TBP | small_intestine | 6.69101 |
| TATA | small_intestine | 11.1591 |
| RREB-1 | small_intestine | 7.80734 |
| PBX-1 | small_intestine | 8.08427 |
| OCT-1 | small_intestine | 7.8228 |
| NRSF | small_intestine | 8.03463 |
| NR2E3 | small_intestine | 6.67947 |
| MRF-2 | small_intestine | 6.56598 |
| MEF-2 | small_intestine | 8.41707 |
| MAZR | small_intestine | 10.6209 |
| MAZ | small_intestine | 6.45887 |
| LHX3 | small_intestine | 12.7273 |
| HNF-3ALPHA | small_intestine | 14.3419 |
| HFH-3 | small_intestine | 6.24907 |
| COUP-TF/HNF-4 | small_intestine | 7.73464 |
| CDP | small_intestine | 7.10754 |
| C/EBPALPHA | small_intestine | 7.3231 |
| C/EBP | small_intestine | 9.7094 |
| AREB6 | small_intestine | 7.63721 |
| CDP | skin | 7.29602 |
| OCT-1 | prostate | 6.52137 |
| NF-E2 | prostate | 6.6268 |
| AP-1 | prostate | 7.00447 |
| SRY | peripheral_nervous_system | 9.89991 |
| RP58 | peripheral_nervous_system | 9.42773 |
| MRF-2 | peripheral_nervous_system | 9.15571 |
| HNF-3ALPHA | peripheral_nervous_system | 12.1497 |
| HNF-1 | peripheral_nervous_system | 15.4284 |
| HFH-4 | peripheral_nervous_system | 10.8122 |
| GCNF | peripheral_nervous_system | 11.4572 |
| FAC1 | peripheral_nervous_system | 9.40174 |
| CDP_CR1 | peripheral_nervous_system | 8.18913 |
| CDP | peripheral_nervous_system | 7.69111 |
| CACCC-BINDING_FACTOR | peripheral_nervous_system | 7.22821 |
| C/EBPDELTA | peripheral_nervous_system | 8.67248 |
| C/EBPBETA | peripheral_nervous_system | 10.4152 |
| C/EBPALPHA | peripheral_nervous_system | 6.37026 |
| C/EBP | peripheral_nervous_system | 8.82513 |
| ATF | pancreas | 7.26168 |
| USF | muscle | 7.90796 |
| TAL-1BETA/ITF-2 | muscle | 11.1236 |
| TAL-1BETA/E47 | muscle | 10.3924 |
| TAL-1ALPHA/E47 | muscle | 7.27171 |
| STAT5A | muscle | 6.88148 |
| SREBP-1 | muscle | 9.08631 |
| MEIS1 | muscle | 6.16219 |
| MEF-2 | muscle | 8.57499 |
| HEB | muscle | 7.76064 |
| C/EBP | muscle | 6.30283 |
| E2F | mammary_gland | 12.1579 |
| E2F | lung | 7.12503 |
| HNF-4 | liver | 6.56143 |
| HNF-1 | liver | 7.29323 |
| TBP | larynx | 6.47489 |
| MEF-2 | larynx | 6.8419 |
| CRX | kidney | 6.89318 |
| LMO2_COMPLEX | heart | 6.51869 |
| GATA-6 | heart | 7.93685 |
| PBX1B | eye | 7.16524 |
| GATA-6 | eye | 6.6496 |
| TBP | colon | 6.51934 |
| TATA | colon | 7.18279 |
| STAT5A | colon | 6.3383 |
| OCT-1 | colon | 8.40137 |
| HNF-1 | colon | 8.95668 |
| TAL-1ALPHA/E47 | brain | 8.15638 |
| SMAD-3 | brain | 8.63251 |
| OCT-X | brain | 11.1469 |
| MZF1 | brain | 9.52379 |
| MRF-2 | brain | 10.3548 |
| ISRE | brain | 6.6418 |
| ICSBP | brain | 10.1192 |
| GATA-1 | brain | 6.23264 |
| FREAC-4 | brain | 6.58069 |
| FOXJ2 | brain | 9.17528 |
| ERR_ALPHA | brain | 7.00077 |
| CHX10 | brain | 9.22861 |
| CDC5 | brain | 12.282 |
| CACCC-BINDING_FACTOR | brain | 7.29891 |
| AMEF-2 | brain | 7.80776 |
| AFP1 | brain | 7.01756 |
| HLF | bone_marrow | 6.65324 |
| FOXO4 | bone_marrow | 6.58956 |
| FAC1 | bone_marrow | 6.62659 |
| AP-3 | bone_marrow | 10.9339 |
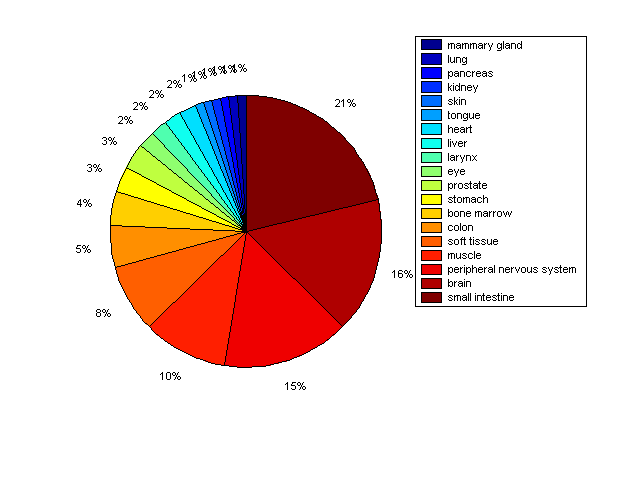
Distribution of Co-regulatory TFs
|
|
|
Description: this pie chart displays the distribution of co-regulatory transcription factors (TFs) in different tissues. Color schema: the tissue with the largest percentage of co-regulatory TFs is colored dark red whereas the tissue with the smallest percentage of co-regulatory TFs is colored dark blue. Tissues with intermediate percentages of co-regulatory TFs are colored from light red to yellow and cyan and then to light blue. |