Summary Table (Download Table)
| Co-regulatory TF | Tissue | -log(P) |
  | | |
| AFP1 | heart | 8.07237 |
| AHR/ARNT | small_intestine | 6.45327 |
| AMEF-2 | brain | 7.04983 |
| AP-4 | skin | 10.209 |
| ARNT | muscle | 7.00458 |
| ATF | larynx | 6.66845 |
| ATF-1 | testis | 7.66858 |
| BSAP | bone | 8.08163 |
| C-MYC/MAX | muscle | 6.9831 |
| C/EBP | bone | 12.2261 |
| C/EBP | brain | 7.61824 |
| C/EBPALPHA | brain | 7.51248 |
| C/EBPBETA | brain | 7.87062 |
| CACCC-BINDING_FACTOR | skin | 7.44346 |
| CART-1 | small_intestine | 16.4915 |
| CDP | heart | 6.21448 |
| CDP | small_intestine | 7.43566 |
| CREB | skin | 7.57297 |
| E12 | bone | 6.69008 |
| E12 | pancreas | 10.2426 |
| E47 | bone | 6.52608 |
| E4BP4 | brain | 6.27135 |
| EF-C | bone | 123.602 |
| ELK-1 | testis | 8.24592 |
| ER | skin | 7.36216 |
| ER | testis | 6.3243 |
| ETF | bone_marrow | 7.84479 |
| ETF | thymus | 6.42632 |
| FREAC-4 | bone | 18.8127 |
| FREAC-7 | brain | 10.1116 |
| GATA-1 | bone | 23.0105 |
| GATA-2 | bone | 21.4024 |
| GATA-3 | bone | 32.5621 |
| GATA-4 | small_intestine | 7.10014 |
| GCM | brain | 7.3772 |
| GR | bone | 9.98246 |
| HEB | skin | 9.94681 |
| HFH-3 | small_intestine | 8.95347 |
| HNF-1 | small_intestine | 14.9813 |
| HNF-3ALPHA | small_intestine | 7.65103 |
| HNF-4 | testis | 6.53416 |
| HSF | testis | 7.38464 |
| IRF-1 | small_intestine | 6.17563 |
| LBP-1 | brain | 6.32287 |
| LBP-1 | muscle | 7.69319 |
| LBP-1 | small_intestine | 6.20459 |
| LEF-1 | brain | 6.2331 |
| LF-A1 | skin | 6.98696 |
| LHX3 | small_intestine | 31.3122 |
| LMO2_COMPLEX | bone | 18.5198 |
| LXR | bone | 8.10898 |
| MAX | muscle | 9.44636 |
| MAZ | bone | 26.3516 |
| MAZR | bone | 10.2453 |
| MEF-2 | heart | 7.11767 |
| MIF-1 | bone | 73.6438 |
| MYOD | brain | 6.85872 |
| MYOD | muscle | 7.00859 |
| MYOD | pancreas | 7.04815 |
| MZF1 | bone | 7.11896 |
| MZF1 | colon | 8.40355 |
| MZF1 | skin | 8.25358 |
| NF-AT | small_intestine | 11.6697 |
| NF-KAPPAB_(P65) | bone | 6.77174 |
| NF-MUE1 | small_intestine | 6.61115 |
| NKX3A | bone | 7.34258 |
| NKX6-2 | small_intestine | 13.4946 |
| NRF-1 | testis | 17.6706 |
| NRSF | skin | 9.46177 |
| P300 | brain | 7.7514 |
| PAX-1 | brain | 6.55411 |
| PBX-1 | small_intestine | 12.9795 |
| PEA3 | testis | 6.43853 |
| POU3F2 | heart | 8.2023 |
| POU3F2 | small_intestine | 10.7725 |
| PU.1 | bone | 11.309 |
| RFX1 | bone | 125.257 |
| RREB-1 | larynx | 6.2988 |
| SF-1 | testis | 12.5284 |
| SMAD-3 | brain | 17.9671 |
| SMAD-4 | brain | 8.90361 |
| SMAD-4 | skin | 8.52813 |
| SP1 | larynx | 6.76983 |
| SP1 | testis | 8.89502 |
| SP3 | tongue | 9.69642 |
| SREBP-1 | bone | 13.0611 |
| SREBP-1 | muscle | 11.7853 |
| SRF | larynx | 10.4312 |
| SRF | muscle | 12.3709 |
| TAL-1ALPHA/E47 | pancreas | 6.40053 |
| TAL-1BETA/ITF-2 | pancreas | 6.55864 |
| TCF-4 | small_intestine | 7.21042 |
| TCF11/MAFG | eye | 8.70978 |
| TST-1 | brain | 8.10709 |
| USF | bone | 7.85316 |
| USF | muscle | 12.3099 |
| USF | testis | 6.64631 |
| USF2 | muscle | 8.78042 |
| VDR | skin | 8.45054 |
| ZIC2 | bone | 7.882 |
| ZID | muscle | 6.5008 |
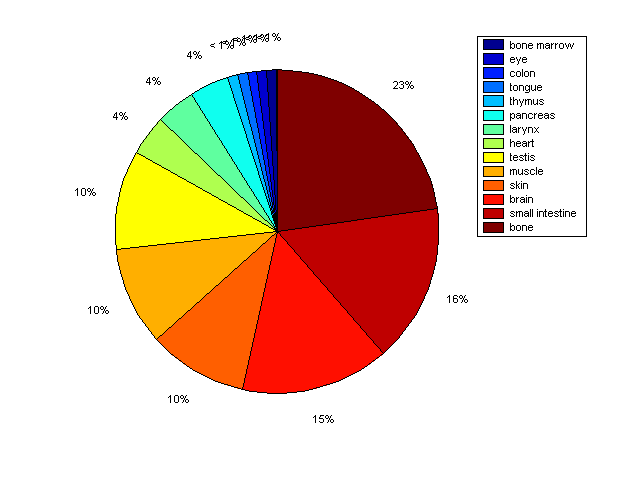
Distribution of Co-regulatory TFs
|
|
|
Description: this pie chart displays the distribution of co-regulatory transcription factors (TFs) in different tissues. Color schema: the tissue with the largest percentage of co-regulatory TFs is colored dark red whereas the tissue with the smallest percentage of co-regulatory TFs is colored dark blue. Tissues with intermediate percentages of co-regulatory TFs are colored from light red to yellow and cyan and then to light blue. |