Summary Table (Download Table)
| Co-regulatory TF | Tissue | -log(P) |
  | | |
| AP-4 | brain | 9.74431 |
| MZF1 | brain | 8.99015 |
| NRSF | brain | 8.93225 |
| STAT1 | brain | 8.70182 |
| CREB | brain | 7.88354 |
| MIF-1 | brain | 7.7514 |
| GCM | larynx | 7.50618 |
| AP-2 | tongue | 7.44162 |
| SP3 | spleen | 7.39297 |
| BSAP | tongue | 7.28083 |
| PPAR | larynx | 7.12192 |
| RREB-1 | brain | 7.05756 |
| CRE-BP1/C-JUN | peripheral_nervous_system | 6.97293 |
| ARP-1 | eye | 6.8881 |
| AP-2ALPHA | small_intestine | 6.7814 |
| AP-2ALPHA | brain | 6.55299 |
| RSRFC4 | kidney | 6.44909 |
| TFII-I | larynx | 6.30461 |
| STAT1 | tongue | 6.28297 |
| NF-Y | blood | 6.26276 |
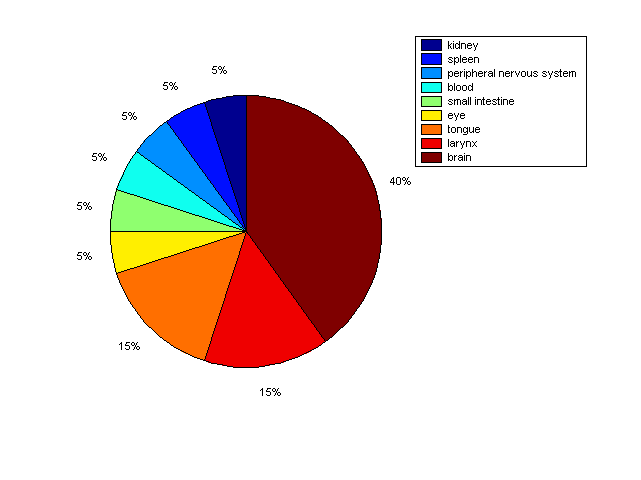
Distribution of Co-regulatory TFs
|
|
|
Description: this pie chart displays the distribution of co-regulatory transcription factors (TFs) in different tissues. Color schema: the tissue with the largest percentage of co-regulatory TFs is colored dark red whereas the tissue with the smallest percentage of co-regulatory TFs is colored dark blue. Tissues with intermediate percentages of co-regulatory TFs are colored from light red to yellow and cyan and then to light blue. |