Summary Table (Download Table)
| Co-regulatory TF | Tissue | -log(P) |
  | | |
| IRF-1 | small_intestine | 6.17928 |
| OCT-1 | kidney | 6.18042 |
| TAL-1BETA/ITF-2 | pancreas | 6.20674 |
| FOXO1 | eye | 6.23211 |
| GR | liver | 6.28771 |
| MYOGENIN/NF-1 | kidney | 6.29935 |
| NKX6-1 | small_intestine | 6.3299 |
| MEF-2 | colon | 6.35274 |
| TAL-1BETA/E47 | eye | 6.4969 |
| E47 | pancreas | 6.53166 |
| MEF-2 | small_intestine | 6.5545 |
| PPARG | testis | 6.56919 |
| NF-Y | small_intestine | 6.61648 |
| NKX6-2 | colon | 6.63198 |
| ARP-1 | kidney | 6.68594 |
| SMAD-3 | muscle | 6.69078 |
| HFH-3 | small_intestine | 6.76249 |
| CHX10 | small_intestine | 6.77816 |
| HNF-3ALPHA | small_intestine | 6.91845 |
| AMEF-2 | small_intestine | 6.92319 |
| HEB | pancreas | 6.92985 |
| TAL-1BETA/E47 | pancreas | 7.00615 |
| NKX6-1 | kidney | 7.00917 |
| PAX-1 | brain | 7.09761 |
| MEF-2 | soft_tissue | 7.13895 |
| TAL-1ALPHA/E47 | small_intestine | 7.16221 |
| CREB | eye | 7.17009 |
| PAX-2 | small_intestine | 7.21714 |
| CRX | liver | 7.29691 |
| MYOD | pancreas | 7.38818 |
| TAL-1BETA/ITF-2 | eye | 7.39039 |
| ZID | larynx | 7.41116 |
| FREAC-4 | small_intestine | 7.46945 |
| RREB-1 | muscle | 7.47768 |
| HSF | muscle | 7.50561 |
| AREB6 | small_intestine | 7.51429 |
| CDP | liver | 7.55889 |
| SRY | small_intestine | 7.73464 |
| RSRFC4 | colon | 7.73973 |
| TAL-1ALPHA/E47 | pancreas | 7.79343 |
| AR | small_intestine | 7.91492 |
| AP-3 | kidney | 8.06739 |
| HNF-3ALPHA | liver | 8.21273 |
| ARP-1 | eye | 8.2707 |
| C/EBPALPHA | liver | 8.33661 |
| FOXJ2 | small_intestine | 8.36198 |
| TGIF | kidney | 8.5388 |
| NF-Y | kidney | 8.55664 |
| PAX-8 | soft_tissue | 8.57572 |
| TATA | liver | 8.83228 |
| SRF | heart | 8.83337 |
| PBX-1 | eye | 8.88181 |
| RSRFC4 | soft_tissue | 8.98502 |
| DBP | liver | 9.27943 |
| MAZR | muscle | 9.4943 |
| MEF-2 | muscle | 9.81122 |
| FREAC-3 | small_intestine | 9.82691 |
| AP-1 | larynx | 9.83522 |
| AP-3 | heart | 9.88625 |
| NR2E3 | kidney | 9.98714 |
| GATA-6 | liver | 10.1965 |
| LHX3 | small_intestine | 10.2298 |
| ATF | eye | 10.5914 |
| RFX1 | kidney | 10.6098 |
| E4BP4 | liver | 10.8332 |
| SRF | muscle | 11.1122 |
| HFH-4 | small_intestine | 11.1556 |
| C-MYB | liver | 11.1634 |
| TITF1 | small_intestine | 11.2316 |
| HNF-1 | small_intestine | 11.375 |
| POU3F2 | small_intestine | 11.3879 |
| MEIS1 | kidney | 11.7421 |
| COUP-TF/HNF-4 | kidney | 12.5218 |
| PPARG | kidney | 12.8776 |
| TBP | small_intestine | 13.758 |
| HNF-4 | kidney | 13.9269 |
| FREAC-3 | kidney | 14.0605 |
| HNF-4ALPHA | kidney | 14.5075 |
| AREB6 | kidney | 14.9496 |
| FOXD3 | small_intestine | 15.7545 |
| HNF-1 | liver | 16.8303 |
| NKX6-2 | small_intestine | 17.9996 |
| LBP-1 | muscle | 18.0665 |
| CRX | kidney | 22.6516 |
| HNF-1 | kidney | 52.0041 |
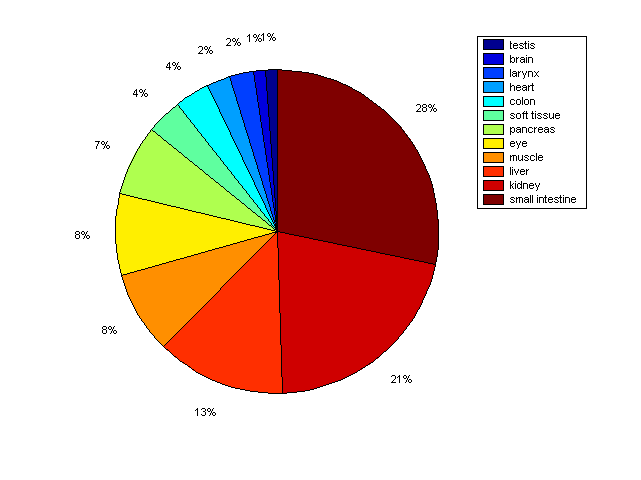
Distribution of Co-regulatory TFs
|
|
|
Description: this pie chart displays the distribution of co-regulatory transcription factors (TFs) in different tissues. Color schema: the tissue with the largest percentage of co-regulatory TFs is colored dark red whereas the tissue with the smallest percentage of co-regulatory TFs is colored dark blue. Tissues with intermediate percentages of co-regulatory TFs are colored from light red to yellow and cyan and then to light blue. |