Summary Table (Download Table)
| Co-regulatory TF | Tissue | -log(P) |
  | | |
| ALPHA-CP1 | small_intestine | 10.2923 |
| AP-1 | heart | 6.20041 |
| AP-2GAMMA | blood | 6.75447 |
| AP-4 | blood | 8.71756 |
| AP-4 | bone | 7.03584 |
| ARNT | muscle | 9.71243 |
| ATF | eye | 7.49046 |
| ATF | kidney | 6.73747 |
| ATF | pancreas | 9.85473 |
| ATF | skin | 7.26625 |
| BSAP | soft_tissue | 6.57435 |
| C-ETS-1 | spleen | 7.05458 |
| C-MYC/MAX | muscle | 7.99233 |
| C/EBP | muscle | 8.05751 |
| C/EBPBETA | muscle | 11.4931 |
| C/EBPDELTA | kidney | 7.26412 |
| CACCC-BINDING_FACTOR | brain | 10.8132 |
| CACCC-BINDING_FACTOR | ovary | 7.11883 |
| CREB | kidney | 6.2558 |
| CREB | soft_tissue | 7.30081 |
| E12 | muscle | 10.7855 |
| E47 | brain | 6.30115 |
| E47 | muscle | 7.6483 |
| EF-C | brain | 6.24901 |
| EGR-1 | skin | 7.08999 |
| EGR-2 | skin | 7.40475 |
| ER | eye | 7.15007 |
| ETF | brain | 13.4819 |
| FOXO1 | soft_tissue | 6.40169 |
| GATA-1 | brain | 6.75125 |
| GATA-1 | muscle | 6.46829 |
| GATA-1 | spleen | 6.51605 |
| GATA-6 | heart | 6.59485 |
| GCM | soft_tissue | 6.30819 |
| GCNF | muscle | 6.64809 |
| HEB | blood | 7.32316 |
| HEB | bone | 8.80839 |
| HIF-1 | bone | 8.31372 |
| HNF-1 | colon | 7.16234 |
| HNF-1 | kidney | 10.9828 |
| HNF-4ALPHA | muscle | 6.6254 |
| LBP-1 | blood | 9.35899 |
| LBP-1 | bone | 7.70418 |
| LBP-1 | brain | 7.27224 |
| LBP-1 | lymph_node | 6.65626 |
| LBP-1 | spleen | 8.99846 |
| LF-A1 | bone | 6.39107 |
| LMO2_COMPLEX | bone | 7.77203 |
| LMO2_COMPLEX | spleen | 8.18664 |
| LUN-1 | brain | 7.28554 |
| LUN-1 | soft_tissue | 9.2515 |
| LXR | small_intestine | 7.37627 |
| MAX | muscle | 8.19528 |
| MAZ | brain | 8.91545 |
| MAZ | heart | 6.19438 |
| MEF-2 | heart | 18.7864 |
| MEF-2 | muscle | 35.8109 |
| MIF-1 | skin | 10.209 |
| MRF-2 | muscle | 6.19787 |
| MZF1 | brain | 9.48016 |
| MZF1 | skin | 6.697 |
| MZF1 | thymus | 6.33637 |
| NERF1A | spleen | 6.86791 |
| NF-1 | muscle | 7.68989 |
| NF-KAPPAB | lymph_node | 7.80696 |
| NF-KAPPAB | spleen | 7.98481 |
| NF-KAPPAB_(P50) | soft_tissue | 8.58211 |
| NF-KAPPAB_(P65) | lymph_node | 8.07187 |
| NF-KAPPAB_(P65) | muscle | 8.10018 |
| NF-KAPPAB_(P65) | spleen | 6.89796 |
| NF-Y | muscle | 6.18263 |
| NR2E3 | muscle | 7.96958 |
| NRF-1 | lymph_node | 8.00321 |
| OCT-1 | lymph_node | 6.72751 |
| P300 | brain | 9.74431 |
| P53 | muscle | 6.61636 |
| POU3F2 | thymus | 6.59909 |
| PU.1 | thymus | 9.14562 |
| RFX1 | muscle | 6.34858 |
| RFX1 | skin | 6.20967 |
| RORALPHA1 | muscle | 7.01406 |
| RREB-1 | brain | 7.59533 |
| RREB-1 | muscle | 6.99819 |
| RSRFC4 | heart | 19.076 |
| RSRFC4 | muscle | 34.7063 |
| SF-1 | muscle | 8.06898 |
| SMAD-4 | ovary | 8.0026 |
| SP1 | brain | 7.38751 |
| SP1 | lymph_node | 7.45745 |
| SP1 | pancreas | 7.57475 |
| SREBP-1 | muscle | 18.8422 |
| SRF | heart | 16.3926 |
| SRF | larynx | 8.24415 |
| SRF | prostate | 6.96416 |
| STAT1 | brain | 7.55129 |
| STAT4 | muscle | 6.22248 |
| STAT5B_(HOMODIMER) | muscle | 7.5492 |
| TATA | muscle | 9.07937 |
| TAX/CREB | brain | 8.31178 |
| TAX/CREB | thymus | 6.99001 |
| TBP | heart | 7.83717 |
| TEL-2 | spleen | 7.54689 |
| TITF1 | soft_tissue | 6.27858 |
| USF | muscle | 10.2176 |
| USF2 | muscle | 6.85558 |
| VDR | muscle | 6.41037 |
| ZID | brain | 8.20659 |
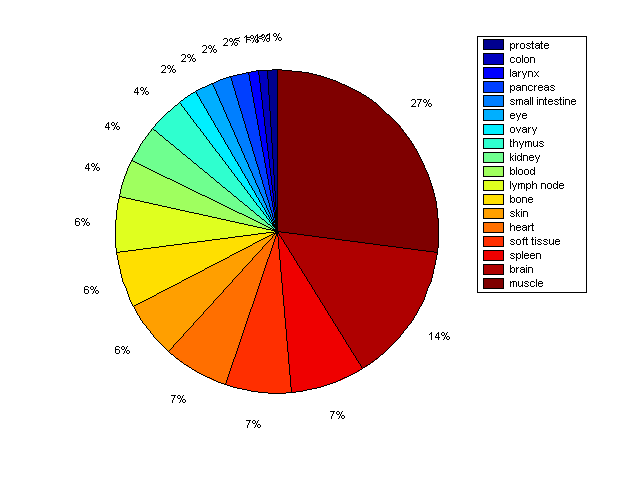
Distribution of Co-regulatory TFs
|
|
|
Description: this pie chart displays the distribution of co-regulatory transcription factors (TFs) in different tissues. Color schema: the tissue with the largest percentage of co-regulatory TFs is colored dark red whereas the tissue with the smallest percentage of co-regulatory TFs is colored dark blue. Tissues with intermediate percentages of co-regulatory TFs are colored from light red to yellow and cyan and then to light blue. |