Summary Table (Download Table)
| Co-regulatory TF | Tissue | -log(P) |
  | | |
| ETF | bladder | 7.06665 |
| GABP | bladder | 6.26469 |
| LBP-1 | bladder | 8.03759 |
| NRF-1 | bladder | 6.48606 |
| SREBP-1 | bladder | 6.83023 |
| ELK-1 | blood | 6.81787 |
| NERF1A | blood | 9.13164 |
| PEA3 | blood | 7.74733 |
| PU.1 | blood | 8.07734 |
| TEL-2 | blood | 6.84199 |
| CHX10 | bone_marrow | 6.1924 |
| CRE-BP1 | bone_marrow | 6.33693 |
| E2F | bone_marrow | 10.0928 |
| E2F-4/DP-1 | bone_marrow | 7.31342 |
| E4BP4 | bone_marrow | 7.51221 |
| E4F1 | bone_marrow | 10.1586 |
| ELK-1 | bone_marrow | 9.09842 |
| GATA-2 | bone_marrow | 6.81612 |
| HLF | bone_marrow | 9.39918 |
| HNF-6 | bone_marrow | 7.20512 |
| LHX3 | bone_marrow | 8.93253 |
| NCX | bone_marrow | 6.96163 |
| NF-Y | bone_marrow | 8.18899 |
| NRF-1 | bone_marrow | 9.45472 |
| PEA3 | bone_marrow | 6.78594 |
| POU3F2 | bone_marrow | 6.31937 |
| PU.1 | bone_marrow | 6.56643 |
| STAT3 | bone_marrow | 7.0115 |
| TEF | bone_marrow | 7.2759 |
| WHN | bone_marrow | 9.67615 |
| AP-4 | brain | 7.55129 |
| MZF1 | brain | 9.59656 |
| P300 | brain | 8.70182 |
| SP1 | brain | 6.89547 |
| ELF-1 | colon | 7.27781 |
| NF-KAPPAB_(P50) | colon | 6.64032 |
| STAT3 | colon | 8.29079 |
| STAT5A_(HOMOTETRAMER) | colon | 10.1271 |
| CHX10 | eye | 7.37342 |
| CRX | eye | 6.46902 |
| E4BP4 | kidney | 7.79313 |
| GATA-X | kidney | 6.63833 |
| HNF-1 | kidney | 6.24402 |
| NR2E3 | kidney | 6.55545 |
| CDP_CR1 | larynx | 6.20649 |
| CDP_CR3+HD | larynx | 8.02587 |
| MEF-2 | larynx | 6.88267 |
| NRF-1 | larynx | 7.10022 |
| PBX-1 | larynx | 6.34399 |
| TEL-2 | lymph_node | 6.90302 |
| HFH-4 | mammary_gland | 6.18806 |
| HNF-3ALPHA | mammary_gland | 6.81168 |
| SP3 | mammary_gland | 6.17617 |
| SREBP-1 | mammary_gland | 6.31094 |
| CDP_CR3+HD | muscle | 6.52244 |
| STATX | ovary | 7.25653 |
| NRSF | pancreas | 6.55212 |
| LHX3 | placenta | 6.47526 |
| LHX3 | prostate | 7.36815 |
| STAT6 | prostate | 7.19553 |
| ELK-1 | small_intestine | 6.50335 |
| GATA-4 | small_intestine | 6.91486 |
| HNF-1 | small_intestine | 6.33387 |
| LHX3 | small_intestine | 12.6729 |
| POU3F2 | small_intestine | 6.32893 |
| STAT5A | soft_tissue | 6.86123 |
| ATF4 | stomach | 7.29779 |
| C/EBPDELTA | thymus | 7.4155 |
| FOXJ2 | thymus | 6.28028 |
| HNF-6 | thymus | 8.89569 |
| TEF | thymus | 7.5194 |
| E2F | tongue | 6.27735 |
| NF-KAPPAB | tongue | 8.90106 |
| NF-KAPPAB_(P65) | tongue | 6.57888 |
| P300 | tongue | 6.28297 |
| PU.1 | tongue | 6.57214 |
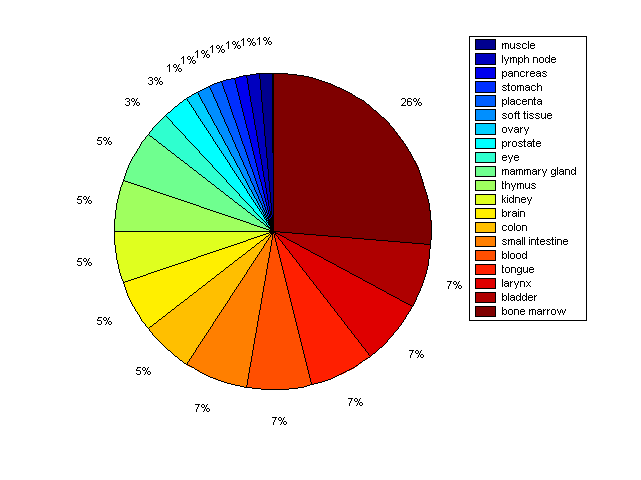
Distribution of Co-regulatory TFs
|
|
|
Description: this pie chart displays the distribution of co-regulatory transcription factors (TFs) in different tissues. Color schema: the tissue with the largest percentage of co-regulatory TFs is colored dark red whereas the tissue with the smallest percentage of co-regulatory TFs is colored dark blue. Tissues with intermediate percentages of co-regulatory TFs are colored from light red to yellow and cyan and then to light blue. |