Summary Table (Download Table)
| Co-regulatory TF | Tissue | -log(P) |
  | | |
| BACH2 | tongue | 6.26027 |
| HNF-6 | thymus | 6.75662 |
| FOXJ2 | thymus | 7.58292 |
| AMEF-2 | thymus | 8.26245 |
| MIF-1 | testis | 6.43853 |
| GABP | testis | 7.08268 |
| ELK-1 | testis | 7.20339 |
| ZID | stomach | 7.02204 |
| TEL-2 | stomach | 6.41795 |
| NERF1A | stomach | 7.81896 |
| ATF4 | stomach | 6.99082 |
| WHN | small_intestine | 9.30862 |
| USF2 | small_intestine | 6.88423 |
| USF | small_intestine | 7.64157 |
| SRF | small_intestine | 7.74605 |
| SREBP-1 | small_intestine | 6.17433 |
| RB/E2F-1/DP-1 | small_intestine | 12.5155 |
| HIF-1 | small_intestine | 6.99115 |
| E2F | small_intestine | 8.40758 |
| C-MYC/MAX | small_intestine | 7.6481 |
| ARNT | small_intestine | 7.23594 |
| LHX3 | placenta | 6.54305 |
| ATF | placenta | 6.20955 |
| FAC1 | mammary_gland | 8.30564 |
| PU.1 | lymph_node | 14.3003 |
| NF-KAPPAB | lymph_node | 6.17553 |
| NF-AT | lymph_node | 9.70025 |
| NF-1 | lymph_node | 6.54977 |
| NERF1A | lymph_node | 10.8116 |
| LMO2_COMPLEX | lymph_node | 6.81853 |
| ELK-1 | lymph_node | 7.61755 |
| AML1 | lymph_node | 11.329 |
| AML-1A | lymph_node | 11.329 |
| WHN | larynx | 7.04032 |
| RREB-1 | larynx | 7.85617 |
| P53 | larynx | 6.38592 |
| NRF-1 | larynx | 7.57709 |
| MEIS1 | larynx | 7.18828 |
| ETF | larynx | 10.0128 |
| ELK-1 | larynx | 6.39983 |
| EGR-3 | larynx | 6.54639 |
| MEF-2 | heart | 6.64298 |
| ELK-1 | cervix | 6.56518 |
| TEL-2 | bone_marrow | 9.2984 |
| STAT5A | bone_marrow | 7.44406 |
| STAT1 | bone_marrow | 6.78594 |
| SRF | bone_marrow | 6.58852 |
| PU.1 | bone_marrow | 10.3084 |
| PEA3 | bone_marrow | 7.62233 |
| FOXO4 | bone_marrow | 8.80176 |
| ELK-1 | bone_marrow | 12.5379 |
| ELF-1 | bone_marrow | 12.9596 |
| E4F1 | bone_marrow | 8.25906 |
| CRE-BP1 | bone_marrow | 6.22737 |
| CDC5 | bone_marrow | 7.43729 |
| BACH1 | bone_marrow | 8.9588 |
| ATF-1 | bone_marrow | 6.84318 |
| AP-1 | bone_marrow | 9.89696 |
| TEL-2 | blood | 16.1045 |
| STATX | blood | 6.99509 |
| STAT1 | blood | 7.74733 |
| PU.1 | blood | 20.6569 |
| PPAR | blood | 6.38103 |
| PEA3 | blood | 11.6372 |
| OSF2 | blood | 7.17001 |
| NF-KAPPAB | blood | 6.57084 |
| NERF1A | blood | 6.38837 |
| GABP | blood | 7.5369 |
| FXR | blood | 6.29979 |
| ELK-1 | blood | 9.75145 |
| ELF-1 | blood | 20.7971 |
| CRE-BP1 | blood | 7.24988 |
| C-ETS-2 | blood | 9.44435 |
| C-ETS-1 | blood | 13.456 |
| AP-1 | blood | 7.47036 |
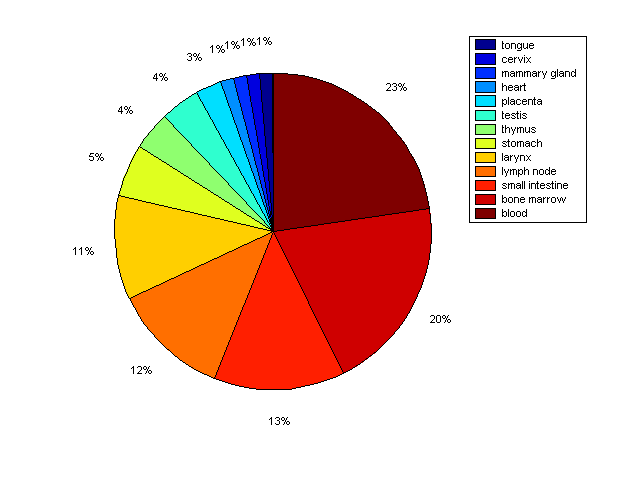
Distribution of Co-regulatory TFs
|
|
|
Description: this pie chart displays the distribution of co-regulatory transcription factors (TFs) in different tissues. Color schema: the tissue with the largest percentage of co-regulatory TFs is colored dark red whereas the tissue with the smallest percentage of co-regulatory TFs is colored dark blue. Tissues with intermediate percentages of co-regulatory TFs are colored from light red to yellow and cyan and then to light blue. |