Summary Table (Download Table)
| Co-regulatory TF | Tissue | -log(P) |
  | | |
| TCF11/MAFG | thymus | 6.57621 |
| WHN | small_intestine | 6.2165 |
| NRSF | small_intestine | 6.39914 |
| FOXO1 | small_intestine | 6.57447 |
| NF-Y | peripheral_nervous_system | 7.15848 |
| TAL-1BETA/E47 | pancreas | 8.01771 |
| MYOD | pancreas | 6.4431 |
| MIF-1 | pancreas | 6.55864 |
| E12 | pancreas | 6.88503 |
| COUP-TF/HNF-4 | pancreas | 6.20674 |
| TGIF | muscle | 7.56814 |
| TAX/CREB | muscle | 6.27332 |
| TATA | muscle | 7.5491 |
| TAL-1BETA/ITF-2 | muscle | 7.31124 |
| TAL-1BETA/E47 | muscle | 10.6216 |
| TAL-1ALPHA/E47 | muscle | 9.94304 |
| STAT6 | muscle | 8.58839 |
| STAT5A | muscle | 8.10968 |
| STAT4 | muscle | 7.29272 |
| SRY | muscle | 11.1236 |
| SRF | muscle | 7.2139 |
| SREBP-1 | muscle | 6.55136 |
| SMAD-4 | muscle | 6.92527 |
| RREB-1 | muscle | 8.03888 |
| RORALPHA1 | muscle | 6.58843 |
| PPARG | muscle | 8.82759 |
| PPARALPHA/RXR-ALPHA | muscle | 6.26824 |
| PITX2 | muscle | 7.55082 |
| P53 | muscle | 7.19204 |
| NF-Y | muscle | 6.88651 |
| NF-E2 | muscle | 12.1581 |
| NF-1 | muscle | 6.28478 |
| MYOGENIN/NF-1 | muscle | 7.76363 |
| MEF-2 | muscle | 6.89678 |
| HMG_IY | muscle | 10.8492 |
| HEB | muscle | 21.4048 |
| GR | muscle | 7.38513 |
| GATA-1 | muscle | 7.54634 |
| ERR_ALPHA | muscle | 6.74581 |
| CRX | muscle | 9.93203 |
| CDP_CR3+HD | muscle | 6.86508 |
| C/EBPDELTA | muscle | 7.36213 |
| C-MYB | muscle | 8.28106 |
| AP-1 | muscle | 14.9887 |
| P53 | larynx | 6.45738 |
| AR | larynx | 7.63068 |
| PITX2 | heart | 6.78146 |
| CRX | eye | 12.8105 |
| COUP-TF/HNF-4 | eye | 7.39039 |
| AP-1 | eye | 8.07045 |
| TAX/CREB | brain | 7.30912 |
| SOX-9 | brain | 6.24367 |
| PPARG | brain | 7.23049 |
| NKX6-2 | brain | 6.48818 |
| HNF-4 | brain | 7.509 |
| GATA-1 | brain | 6.48226 |
| EF-C | brain | 6.20537 |
| ATF | bone | 7.67536 |
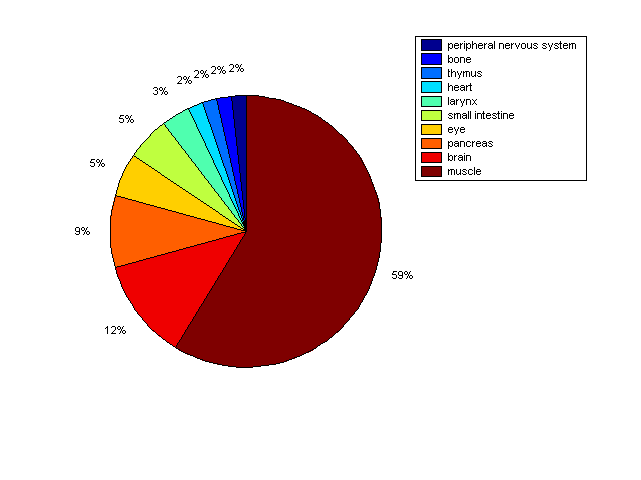
Distribution of Co-regulatory TFs
|
|
|
Description: this pie chart displays the distribution of co-regulatory transcription factors (TFs) in different tissues. Color schema: the tissue with the largest percentage of co-regulatory TFs is colored dark red whereas the tissue with the smallest percentage of co-regulatory TFs is colored dark blue. Tissues with intermediate percentages of co-regulatory TFs are colored from light red to yellow and cyan and then to light blue. |