Summary Table (Download Table)
| Co-regulatory TF | Tissue | -log(P) |
  | | |
| AHR/ARNT | muscle | 7.22444 |
| ALPHA-CP1 | brain | 6.81106 |
| AMEF-2 | heart | 12.1642 |
| AMEF-2 | muscle | 15.8031 |
| AP-3 | peripheral_nervous_system | 10.2665 |
| AP-3 | soft_tissue | 11.9971 |
| AP-4 | brain | 7.59533 |
| AP-4 | muscle | 6.99819 |
| AR | brain | 8.36467 |
| AR | larynx | 6.87232 |
| AREB6 | larynx | 7.98328 |
| ARNT | small_intestine | 6.29811 |
| ATF-1 | peripheral_nervous_system | 7.24737 |
| C/EBPBETA | brain | 10.2585 |
| CDC5 | heart | 9.05083 |
| CDP | peripheral_nervous_system | 7.69987 |
| COUP-TF/HNF-4 | muscle | 7.47768 |
| CRE-BP1 | thymus | 6.37424 |
| E2F | muscle | 8.55341 |
| E2F | small_intestine | 7.63295 |
| E2F-4/DP-1 | small_intestine | 6.22115 |
| ERR_ALPHA | muscle | 7.85671 |
| ETF | tongue | 7.55385 |
| FOXJ2 | heart | 7.07302 |
| FOXJ2 | small_intestine | 6.4139 |
| GATA-1 | brain | 13.312 |
| GATA-3 | brain | 6.79017 |
| GCNF | brain | 12.9696 |
| GR | muscle | 8.61282 |
| HNF-4 | brain | 8.10482 |
| HSF1 | soft_tissue | 6.24613 |
| HSF2 | brain | 9.67435 |
| LBP-1 | brain | 8.4002 |
| LBP-1 | eye | 6.65407 |
| LF-A1 | muscle | 6.5611 |
| LMO2_COMPLEX | larynx | 7.7363 |
| LUN-1 | soft_tissue | 6.69129 |
| LXR | small_intestine | 7.59335 |
| MAX | larynx | 6.48812 |
| MAZR | brain | 7.33652 |
| MEF-2 | heart | 8.3006 |
| MEF-2 | muscle | 22.6528 |
| MIF-1 | larynx | 6.2988 |
| MYOD | thymus | 7.08574 |
| MYOGENIN/NF-1 | muscle | 7.2266 |
| MYOGENIN/NF-1 | small_intestine | 6.24907 |
| MZF1 | brain | 8.99698 |
| MZF1 | muscle | 9.20418 |
| MZF1 | skin | 6.44562 |
| MZF1 | thymus | 8.52926 |
| NERF1A | soft_tissue | 6.30711 |
| NERF1A | spleen | 7.26544 |
| NF-E2 | eye | 6.90142 |
| NF-KAPPAB_(P50) | eye | 6.38846 |
| NF-KAPPAB_(P50) | ovary | 6.85802 |
| NKX3A | larynx | 8.03457 |
| NR2E3 | muscle | 6.24551 |
| NRF-1 | small_intestine | 13.5674 |
| NRL | brain | 6.74913 |
| NRL | heart | 7.56381 |
| NRSF | brain | 10.5979 |
| OCT-1 | brain | 7.61623 |
| OCT-1 | peripheral_nervous_system | 7.33203 |
| P300 | brain | 7.05756 |
| PAX-1 | peripheral_nervous_system | 9.40527 |
| PAX-2 | muscle | 6.85145 |
| PEA3 | larynx | 7.85617 |
| POU3F2 | heart | 13.2477 |
| PPARALPHA/RXR-ALPHA | muscle | 9.46249 |
| RB/E2F-1/DP-1 | small_intestine | 8.9161 |
| RSRFC4 | heart | 6.89681 |
| RSRFC4 | muscle | 15.2617 |
| SMAD-3 | skin | 6.18327 |
| SMAD-4 | eye | 8.10958 |
| SREBP-1 | eye | 6.30842 |
| SRF | brain | 9.60531 |
| SRF | heart | 13.2095 |
| SRF | muscle | 14.6692 |
| SRY | small_intestine | 7.80734 |
| STAT4 | heart | 6.58333 |
| STAT4 | small_intestine | 7.23697 |
| TAL-1BETA/E47 | muscle | 7.89793 |
| TAL-1BETA/ITF-2 | muscle | 8.03888 |
| TATA | bone | 10.9943 |
| TATA | heart | 8.97671 |
| TATA | muscle | 7.29376 |
| TATA | small_intestine | 9.03342 |
| TAX/CREB | thymus | 11.0755 |
| TFII-I | larynx | 15.0496 |
| TST-1 | small_intestine | 8.66058 |
| YY1 | larynx | 7.24547 |
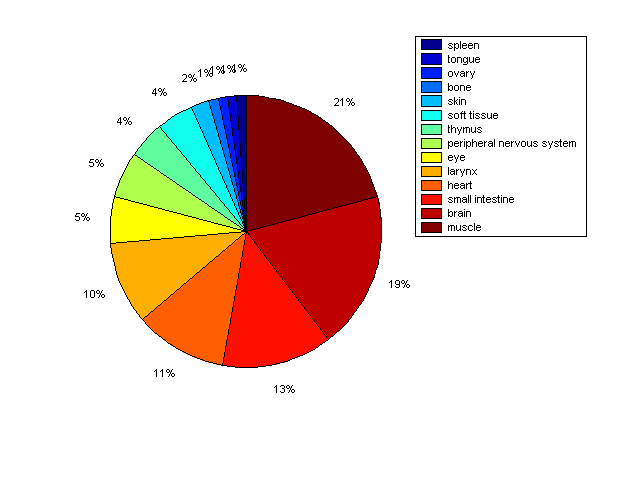
Distribution of Co-regulatory TFs
|
|
|
Description: this pie chart displays the distribution of co-regulatory transcription factors (TFs) in different tissues. Color schema: the tissue with the largest percentage of co-regulatory TFs is colored dark red whereas the tissue with the smallest percentage of co-regulatory TFs is colored dark blue. Tissues with intermediate percentages of co-regulatory TFs are colored from light red to yellow and cyan and then to light blue. |