Summary Table (Download Table)
| Co-regulatory TF | Tissue | -log(P) |
  | | |
| AHR/ARNT | small_intestine | 6.89004 |
| ALX-4 | muscle | 11.1594 |
| AMEF-2 | muscle | 7.55039 |
| AP-2ALPHA | larynx | 7.65728 |
| AP-2GAMMA | larynx | 7.67775 |
| AP-4 | muscle | 9.71243 |
| ARNT | bladder | 16.8525 |
| ARNT | bone_marrow | 6.49699 |
| ARNT | muscle | 9.55606 |
| ATF4 | bladder | 6.78013 |
| ATF6 | bone | 8.91739 |
| ATF6 | bone_marrow | 8.16791 |
| C-MYC/MAX | bladder | 18.1634 |
| C-MYC/MAX | bone | 10.6176 |
| C-MYC/MAX | bone_marrow | 8.13416 |
| C-MYC/MAX | muscle | 9.89139 |
| C-MYC/MAX | small_intestine | 9.77986 |
| C-MYC/MAX | tongue | 8.1325 |
| CACCC-BINDING_FACTOR | muscle | 6.67327 |
| CHX10 | brain | 6.77706 |
| CRE-BP1 | kidney | 6.35951 |
| E47 | skin | 7.19525 |
| EGR-1 | brain | 6.29853 |
| ELK-1 | small_intestine | 7.36873 |
| FREAC-4 | brain | 8.46531 |
| GABP | small_intestine | 10.6868 |
| HIF-1 | tongue | 15.2283 |
| HSF1 | muscle | 6.94516 |
| IPF1 | muscle | 7.76342 |
| LBP-1 | muscle | 13.0077 |
| LEF-1 | pancreas | 7.08286 |
| MAX | bladder | 25.2508 |
| MAX | bone_marrow | 7.00627 |
| MAX | muscle | 9.21425 |
| MEF-2 | muscle | 9.7278 |
| MIF-1 | muscle | 7.00458 |
| MTF-1 | brain | 7.76607 |
| MYOD | muscle | 11.9502 |
| MZF1 | skin | 6.17339 |
| NRF-1 | small_intestine | 7.94559 |
| NRF-1 | testis | 7.14973 |
| NRF-1 | tongue | 10.3451 |
| PAX-2 | bladder | 6.77716 |
| PAX-8 | bladder | 10.8301 |
| PEA3 | small_intestine | 7.23594 |
| POU1F1 | muscle | 6.82011 |
| POU3F2 | muscle | 6.91185 |
| RFX1 | muscle | 9.49403 |
| RREB-1 | small_intestine | 6.29811 |
| RSRFC4 | muscle | 10.7642 |
| SMAD-3 | brain | 9.17931 |
| SMAD-4 | brain | 7.17332 |
| SP1 | testis | 7.29485 |
| SREBP-1 | bladder | 47.6449 |
| SREBP-1 | bone_marrow | 11.5776 |
| SREBP-1 | muscle | 13.423 |
| SREBP-1 | small_intestine | 8.885 |
| SRF | heart | 6.67369 |
| TEF-1 | muscle | 6.20079 |
| TGIF | muscle | 7.07557 |
| USF | bladder | 23.4245 |
| USF | bone_marrow | 8.09608 |
| USF | muscle | 13.3264 |
| USF | small_intestine | 7.00423 |
| USF | tongue | 9.95398 |
| USF2 | bladder | 21.6458 |
| USF2 | bone_marrow | 6.53733 |
| USF2 | muscle | 9.06507 |
| USF2 | tongue | 9.57654 |
| WHN | small_intestine | 6.197 |
| XBP-1 | bladder | 10.7997 |
| XBP-1 | kidney | 7.60387 |
| ZID | small_intestine | 7.29273 |
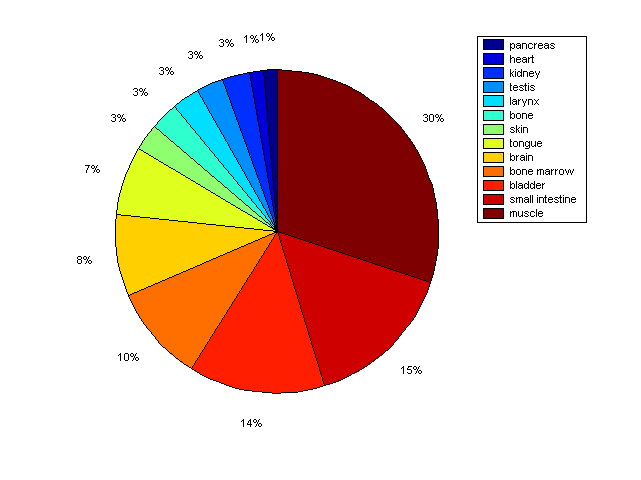
Distribution of Co-regulatory TFs
|
|
|
Description: this pie chart displays the distribution of co-regulatory transcription factors (TFs) in different tissues. Color schema: the tissue with the largest percentage of co-regulatory TFs is colored dark red whereas the tissue with the smallest percentage of co-regulatory TFs is colored dark blue. Tissues with intermediate percentages of co-regulatory TFs are colored from light red to yellow and cyan and then to light blue. |