Summary Table (Download Table)
| Co-regulatory TF | Tissue | -log(P) |
  | | |
| YY1 | mammary_gland | 7.99743 |
| TITF1 | small_intestine | 6.33449 |
| TEF-1 | peripheral_nervous_system | 6.93108 |
| TCF11/MAFG | kidney | 7.3489 |
| TCF-4 | small_intestine | 7.50763 |
| TATA | small_intestine | 7.29105 |
| TATA | kidney | 7.99606 |
| TATA | colon | 8.51396 |
| STAT5B_(HOMODIMER) | soft_tissue | 6.24302 |
| STAT5A_(HOMODIMER) | soft_tissue | 6.18506 |
| SRY | peripheral_nervous_system | 11.4572 |
| SRF | stomach | 7.67224 |
| SRF | small_intestine | 7.73213 |
| RREB-1 | brain | 12.9696 |
| POU3F2 | small_intestine | 6.50134 |
| POU3F2 | colon | 7.45478 |
| POU1F1 | mammary_gland | 6.29005 |
| PITX2 | muscle | 6.86041 |
| OCT-1 | small_intestine | 8.13831 |
| OCT-1 | mammary_gland | 8.26201 |
| OCT-1 | colon | 10.7041 |
| OCT-1 | brain | 6.27224 |
| NKX6-2 | small_intestine | 12.9753 |
| NKX3A | small_intestine | 8.12571 |
| NF-Y | thymus | 11.2855 |
| NF-Y | testis | 7.37943 |
| NF-E2 | lymph_node | 6.24293 |
| NERF1A | brain | 8.62904 |
| MZF1 | brain | 9.74465 |
| MRF-2 | brain | 7.09802 |
| MEF-2 | colon | 6.60014 |
| MAZ | brain | 10.0366 |
| LHX3 | small_intestine | 9.47603 |
| HNF-3ALPHA | peripheral_nervous_system | 8.88485 |
| HNF-3ALPHA | brain | 6.35093 |
| HNF-1 | small_intestine | 8.1216 |
| HNF-1 | peripheral_nervous_system | 7.19435 |
| HNF-1 | kidney | 28.1174 |
| HNF-1 | colon | 16.8359 |
| HFH-3 | peripheral_nervous_system | 8.89266 |
| HFH-3 | brain | 8.15976 |
| HEB | muscle | 8.93288 |
| HAND1/E47 | soft_tissue | 6.34374 |
| GATA-6 | eye | 8.8167 |
| GATA-1 | testis | 7.5514 |
| GATA-1 | small_intestine | 7.07245 |
| FREAC-7 | brain | 7.38102 |
| FREAC-3 | colon | 9.34219 |
| FREAC-2 | kidney | 8.19631 |
| FOXJ2 | brain | 7.64302 |
| FAC1 | peripheral_nervous_system | 6.92638 |
| FAC1 | mammary_gland | 13.4416 |
| EGR-1 | mammary_gland | 6.73223 |
| E4BP4 | kidney | 6.43795 |
| CRX | eye | 9.4728 |
| CREB | skin | 6.5251 |
| CREB | peripheral_nervous_system | 7.65979 |
| CHX10 | kidney | 12.1292 |
| CHX10 | eye | 9.27377 |
| CHOP-C/EBPALPHA | peripheral_nervous_system | 6.89407 |
| CDP | colon | 11.6473 |
| C/EBPBETA | peripheral_nervous_system | 9.16725 |
| C/EBP | peripheral_nervous_system | 6.60599 |
| ATF | peripheral_nervous_system | 9.26828 |
| AR | testis | 6.49573 |
| AP-4 | muscle | 6.64809 |
| AP-2REP | colon | 8.06982 |
| AP-1 | muscle | 7.51146 |
| ALX-4 | colon | 9.83515 |
| AFP1 | colon | 9.93219 |
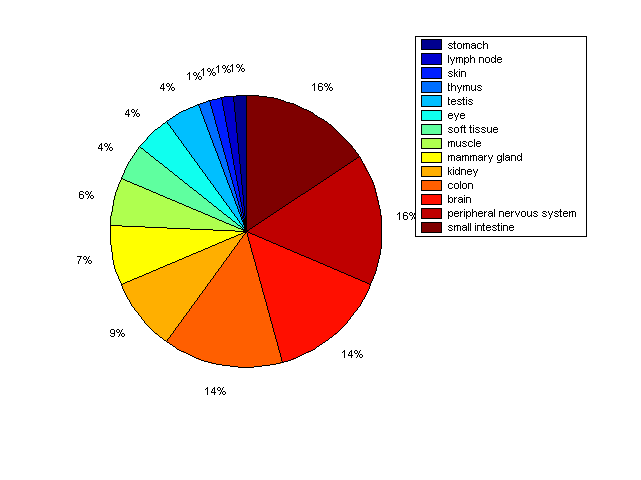
Distribution of Co-regulatory TFs
|
|
|
Description: this pie chart displays the distribution of co-regulatory transcription factors (TFs) in different tissues. Color schema: the tissue with the largest percentage of co-regulatory TFs is colored dark red whereas the tissue with the smallest percentage of co-regulatory TFs is colored dark blue. Tissues with intermediate percentages of co-regulatory TFs are colored from light red to yellow and cyan and then to light blue. |