Summary Table (Download Table)
| Co-regulatory TF | Tissue | -log(P) |
  | | |
| RB/E2F-1/DP-1 | soft_tissue | 6.23427 |
| E2F-1 | thymus | 6.24773 |
| E2F | thymus | 6.25593 |
| E2F-4/DP-2 | bone_marrow | 6.2992 |
| LBP-1 | tongue | 6.33611 |
| MAZR | larynx | 6.34894 |
| E2F-1/DP-2 | bone_marrow | 6.36263 |
| VDR | small_intestine | 6.37313 |
| GATA-X | small_intestine | 6.40868 |
| LBP-1 | brain | 6.59562 |
| PBX-1 | brain | 6.72001 |
| AP-1 | larynx | 6.78802 |
| E2F-4/DP-1 | soft_tissue | 6.83588 |
| HEB | small_intestine | 6.86681 |
| GR | soft_tissue | 6.95091 |
| TST-1 | small_intestine | 7.02768 |
| STAT5A_(HOMOTETRAMER) | soft_tissue | 7.03494 |
| C/EBP | tongue | 7.05585 |
| CDP_CR3 | small_intestine | 7.08482 |
| ETF | bone_marrow | 7.15568 |
| C-MYC/MAX | larynx | 7.24092 |
| E47 | small_intestine | 7.33867 |
| GATA-4 | small_intestine | 7.41667 |
| E2F-4/DP-1 | cervix | 7.4219 |
| E12 | brain | 7.52729 |
| E2F-1 | larynx | 7.55481 |
| TAL-1ALPHA/E47 | small_intestine | 7.67095 |
| ETF | brain | 7.69749 |
| ATF | bone | 7.70528 |
| E2F | bone_marrow | 7.71267 |
| MAZR | tongue | 7.81823 |
| OCT-X | small_intestine | 7.94923 |
| TAX/CREB | thymus | 8.13113 |
| SP1 | tongue | 8.14811 |
| LMO2_COMPLEX | tongue | 8.1538 |
| ELK-1 | testis | 8.19858 |
| SP1 | testis | 8.25803 |
| E2F-1 | cervix | 8.34899 |
| E2F | soft_tissue | 8.78257 |
| RREB-1 | small_intestine | 8.9161 |
| C-MYC/MAX | cervix | 9.01009 |
| ETF | bladder | 9.13452 |
| E2F | cervix | 9.16392 |
| E2F-1 | soft_tissue | 9.46011 |
| NRF-1 | blood | 9.49181 |
| OCT-1 | small_intestine | 9.75769 |
| ZID | larynx | 9.80538 |
| NRF-1 | bone_marrow | 10.0699 |
| E2F | larynx | 10.4386 |
| BACH2 | small_intestine | 11.0668 |
| NRF-1 | bladder | 11.4812 |
| SRF | small_intestine | 11.9255 |
| NRF-1 | tongue | 12.2354 |
| PEA3 | small_intestine | 12.5155 |
| ETF | larynx | 13.6808 |
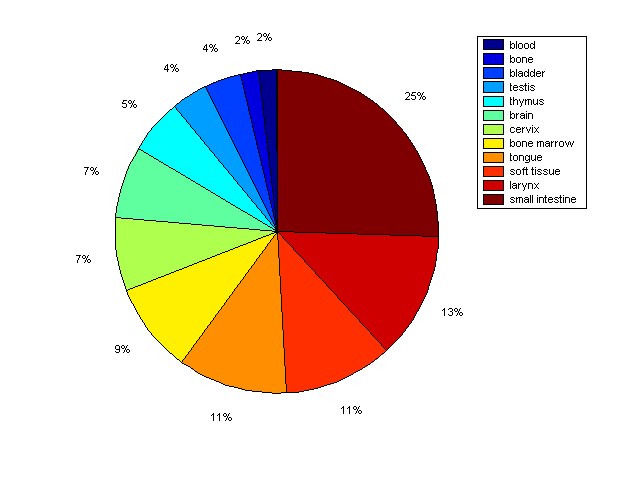
Distribution of Co-regulatory TFs
|
|
|
Description: this pie chart displays the distribution of co-regulatory transcription factors (TFs) in different tissues. Color schema: the tissue with the largest percentage of co-regulatory TFs is colored dark red whereas the tissue with the smallest percentage of co-regulatory TFs is colored dark blue. Tissues with intermediate percentages of co-regulatory TFs are colored from light red to yellow and cyan and then to light blue. |